Fig. 5
Download original image
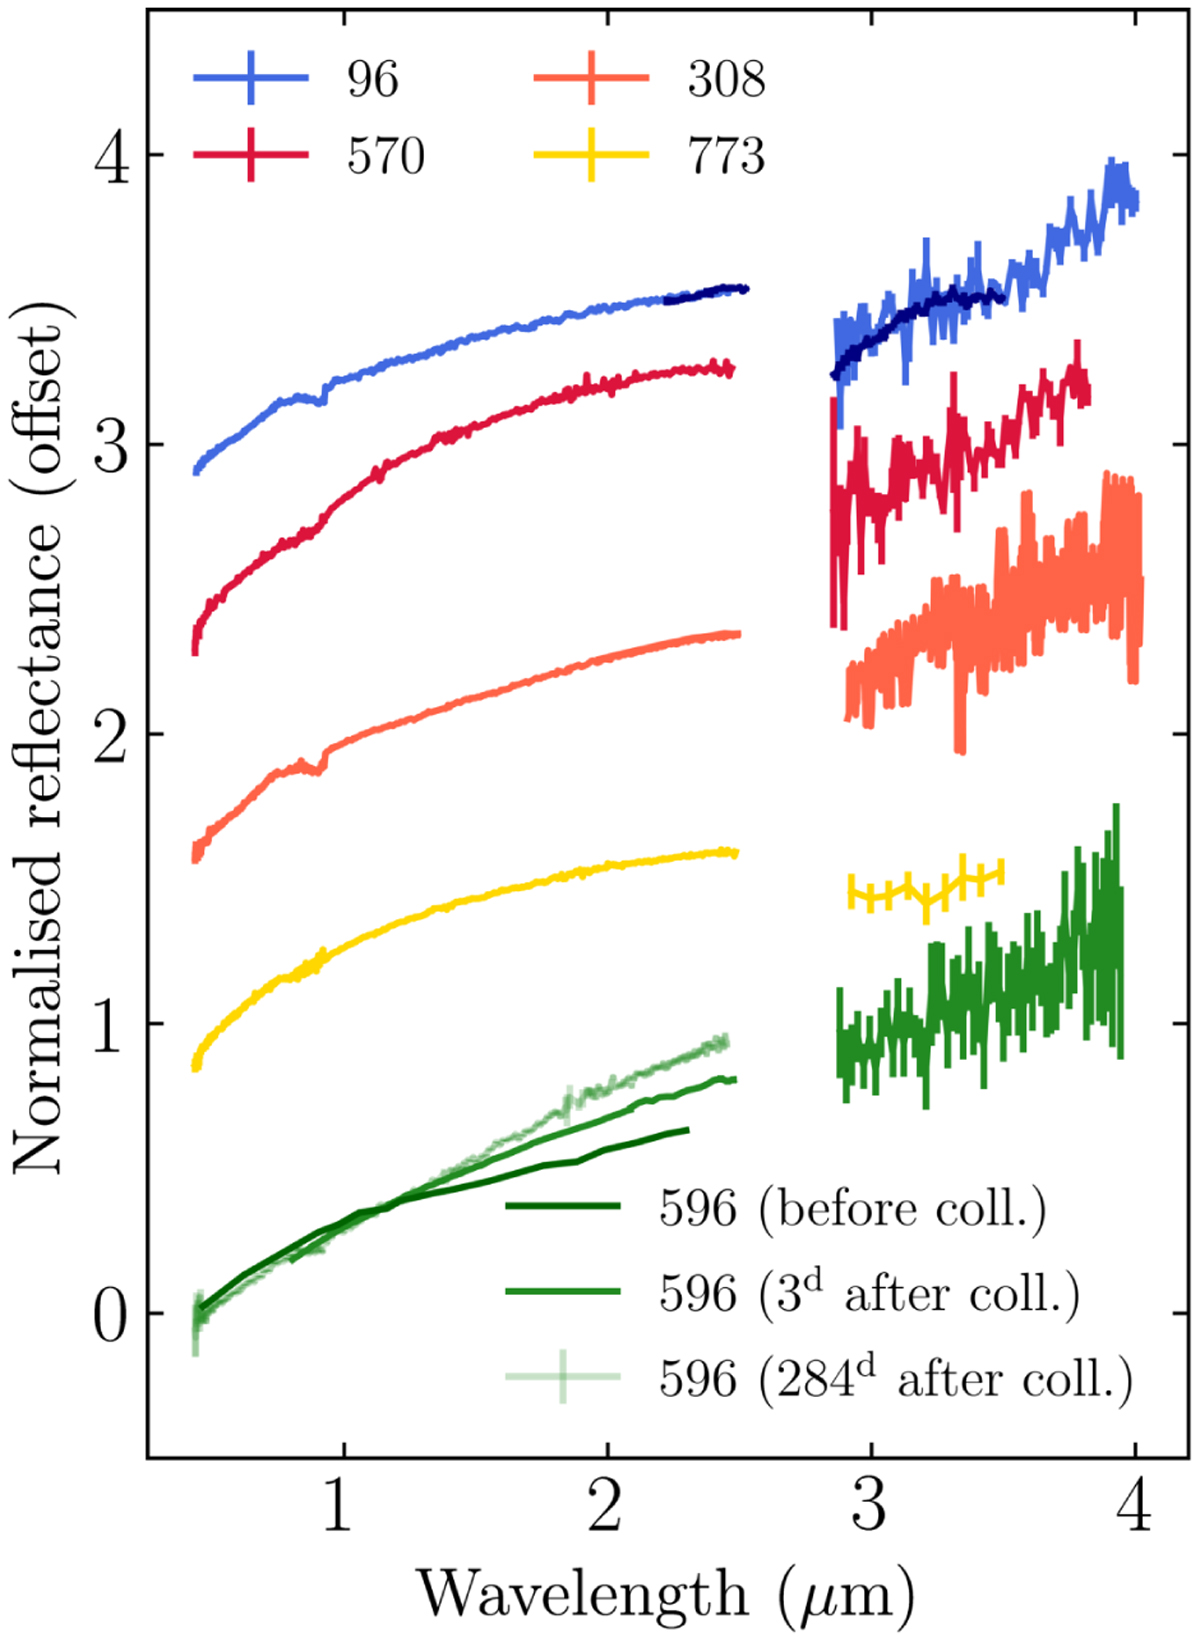
Normalised reflectance of large T types over 0.4−4.0 µm. Each was normalised at 0.55 µm and offset for clarity. The 2.8−1-.0 µm spectra of (96) Aegle and (570) Kythera are from our observations, the 2.23.5 µm spectrum of (96) Aegle (navy line superimposed on the blue curve) is from Fraeman et al. (2014), the 0.4−1-.0 µm spectrum of (308) Polyxo is from Takir & Emery (2012), the 0.8-4.0 µm spectrum of (596) Scheila taken three days after its 2010 impact event is from Yang & Hsieh (2011), and the 2.1−3.5 µm spectrum of (773) Irmintraud is from Kanno et al. (2003). All VNIR spectra except for that of (308) Polyxo are quoted from the SMASSII datasets (DeMeo et al. 2009). The gap over 2.5−2.8 µm illustrates the region that is made opaque by water vapour in Earth’s atmosphere. Weak features around 0.9 µm in all spectra are near the boundary of the visible and near-infrared portions of the spectrum taken at different times with different instruments at edge wavelengths where the detectors are less sensitive (DeMeo et al. 2009).
Current usage metrics show cumulative count of Article Views (full-text article views including HTML views, PDF and ePub downloads, according to the available data) and Abstracts Views on Vision4Press platform.
Data correspond to usage on the plateform after 2015. The current usage metrics is available 48-96 hours after online publication and is updated daily on week days.
Initial download of the metrics may take a while.