Fig. 3
Download original image
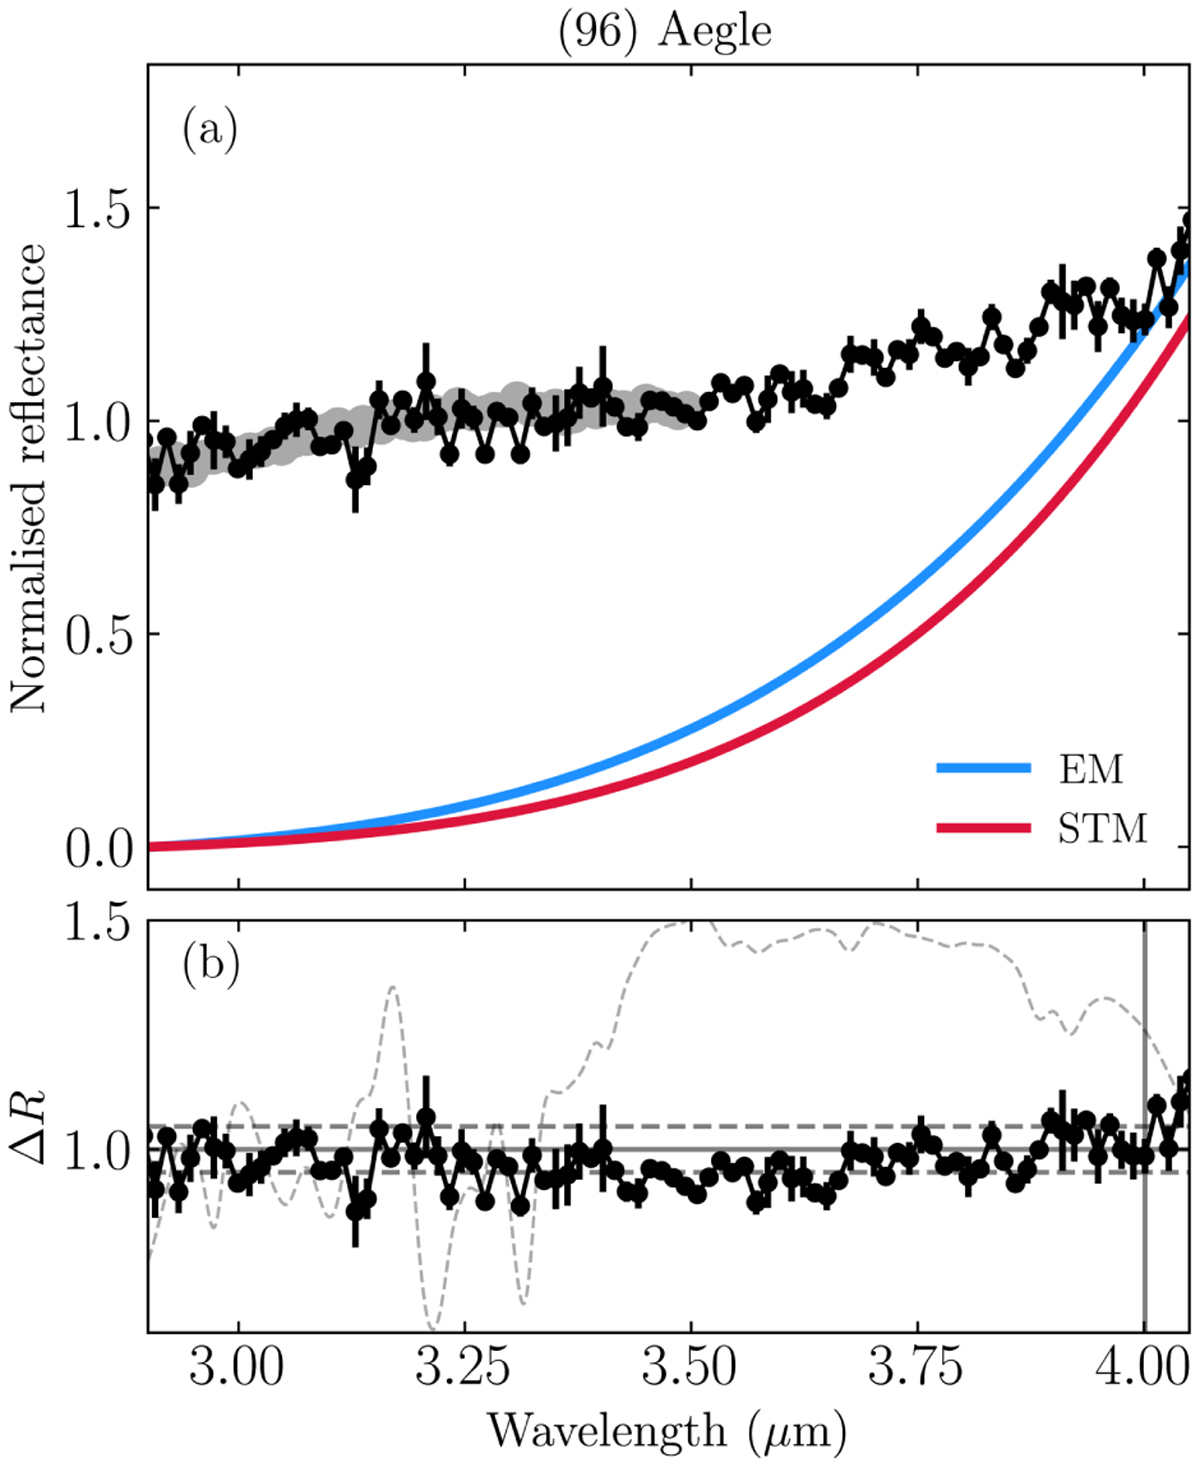
Reflectance R vs wavelength of (96) Aegle, normalised at 3.5 µm. (a) Background grey circles are quoted from Fraeman et al. (2014), who observed the same asteroid at rH = 3.1 au. Blue and red curves denote the expected thermal flux derived from the EM and the STM, respectively. (b) Continuum-removed spectrum (ΔR). The upper and lower dashed lines show the ±5% calibration uncertainty. The dashed curve in the background shows the atmospheric transmission curve modelled by ATRAN (Lord 1992) in the same median airmass of (96) Aegle (Table 1). We multiplied the curve by 1.6 to compare the atmospheric pattern to the observed spectrum. The solid vertical line marks the shortest wavelength where the contribution of the thermal flux to the observed flux becomes non-negligible.
Current usage metrics show cumulative count of Article Views (full-text article views including HTML views, PDF and ePub downloads, according to the available data) and Abstracts Views on Vision4Press platform.
Data correspond to usage on the plateform after 2015. The current usage metrics is available 48-96 hours after online publication and is updated daily on week days.
Initial download of the metrics may take a while.