Open Access
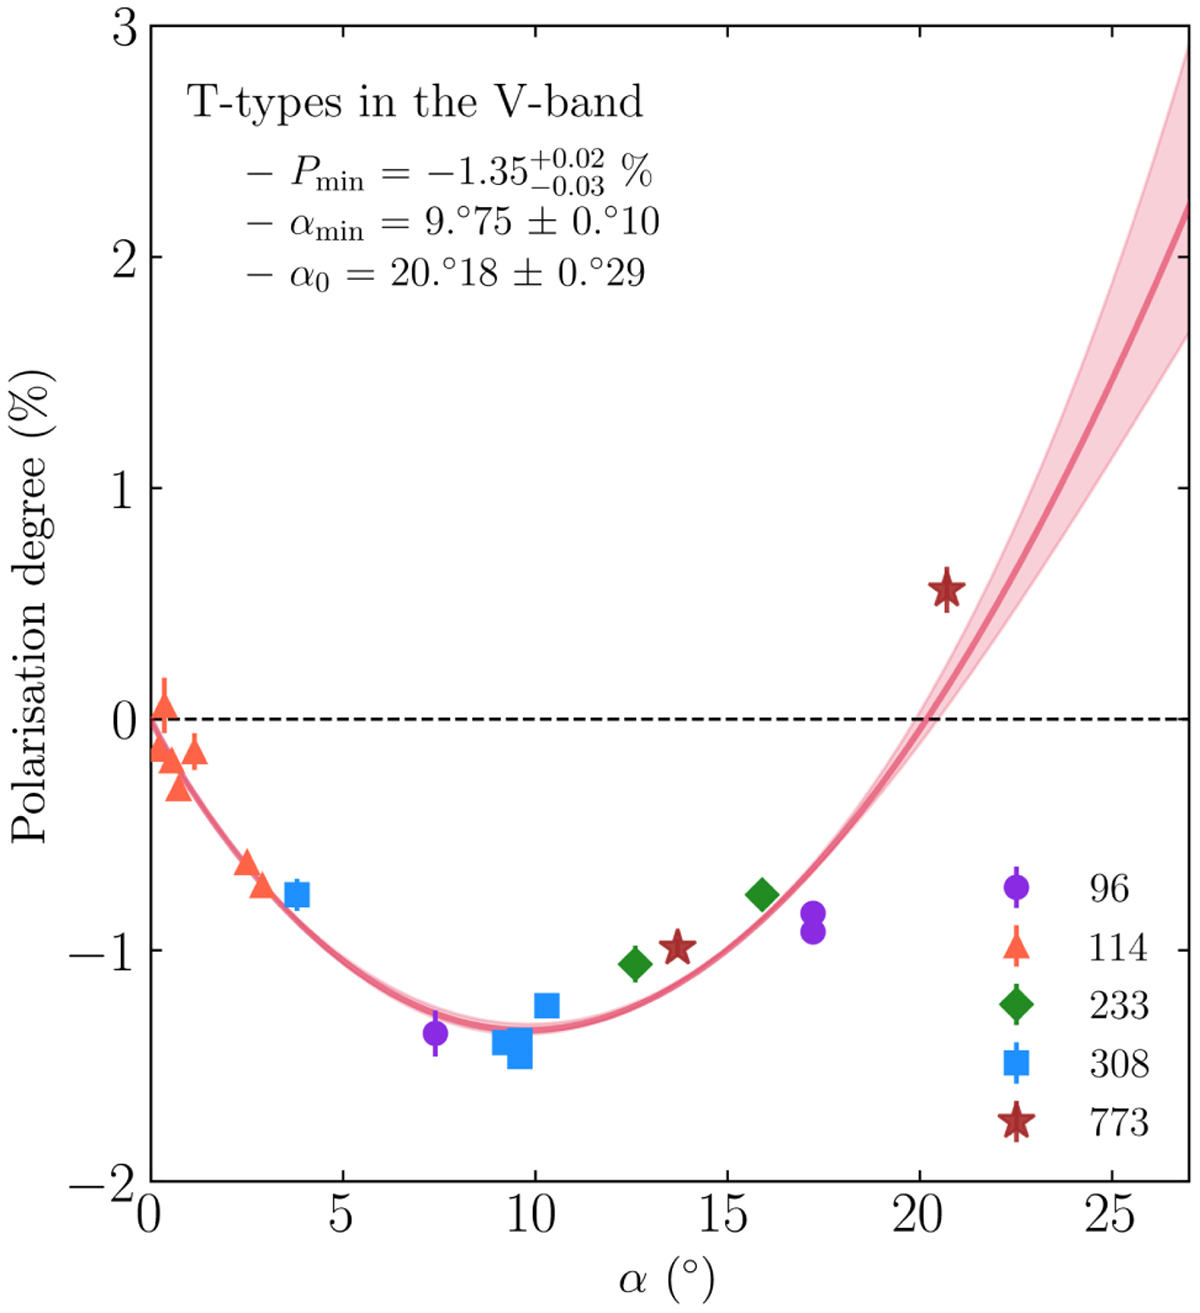
Fig. 10
Download original image
Polarisation of large T-type surfaces vs phase angle in the V band. All data are quoted from the NASA/PDS APD (Lupishko 2022). The solid red curve and shaded area indicate the average dependence curve derived from Eq. (6) and its 1σ uncertainty.
Current usage metrics show cumulative count of Article Views (full-text article views including HTML views, PDF and ePub downloads, according to the available data) and Abstracts Views on Vision4Press platform.
Data correspond to usage on the plateform after 2015. The current usage metrics is available 48-96 hours after online publication and is updated daily on week days.
Initial download of the metrics may take a while.