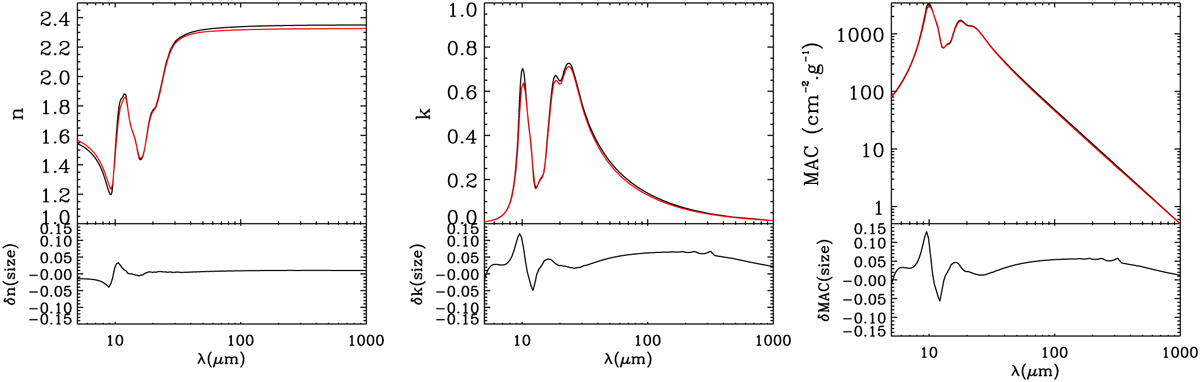
Fig. 8
Download original image
Effect of neglecting the size distribution in the calculation of the optical constants. Calculations are made on a spectrum simulated using optical constants of amorphous forsterite silicates from Jäger et al. (2003) assuming a prolate grain shape with an axis ratio of 2 and a size distribution similar to the one measured experimentally. The top panels of the two left figures show the refractive index, n, and the absorption coefficient, k, from the database (black lines) and those derived from the simulated MAC (red lines); the bottoms panels show the error made on n and k. The right figure shows the simulated MAC (black line) and the new MAC calculated from the n and k derived from the simulated MAC (top panel) and the error made on the MAC (bottom panel).
Current usage metrics show cumulative count of Article Views (full-text article views including HTML views, PDF and ePub downloads, according to the available data) and Abstracts Views on Vision4Press platform.
Data correspond to usage on the plateform after 2015. The current usage metrics is available 48-96 hours after online publication and is updated daily on week days.
Initial download of the metrics may take a while.