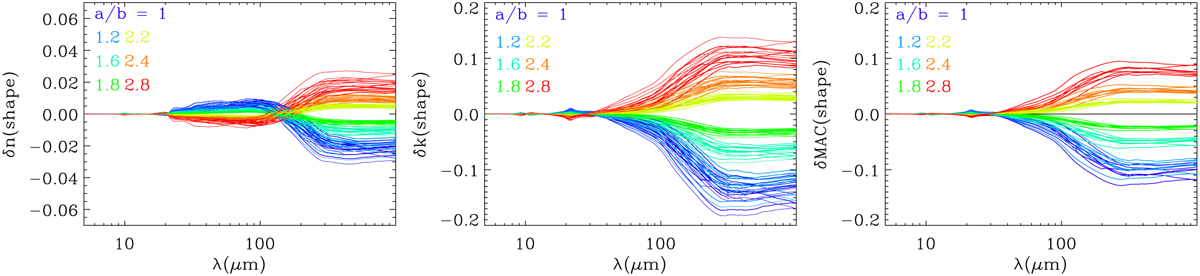
Fig. 7
Download original image
Effect of an error on the grain-shape assumption on the calculated optical constants for Fe-rich samples at 10 K and on the resulting MAC. The results are shown for different grain shapes: spherical (dark blue), prolate (thick lines), and oblate (thin lines) with axis ratios, a/b, of 1.2, 1.6, 1.8, 2.2, 2.4, and 2.8. From left to right, the figures show the resulting errors on n, k, and the MAC.
Current usage metrics show cumulative count of Article Views (full-text article views including HTML views, PDF and ePub downloads, according to the available data) and Abstracts Views on Vision4Press platform.
Data correspond to usage on the plateform after 2015. The current usage metrics is available 48-96 hours after online publication and is updated daily on week days.
Initial download of the metrics may take a while.