Fig. 12
Download original image
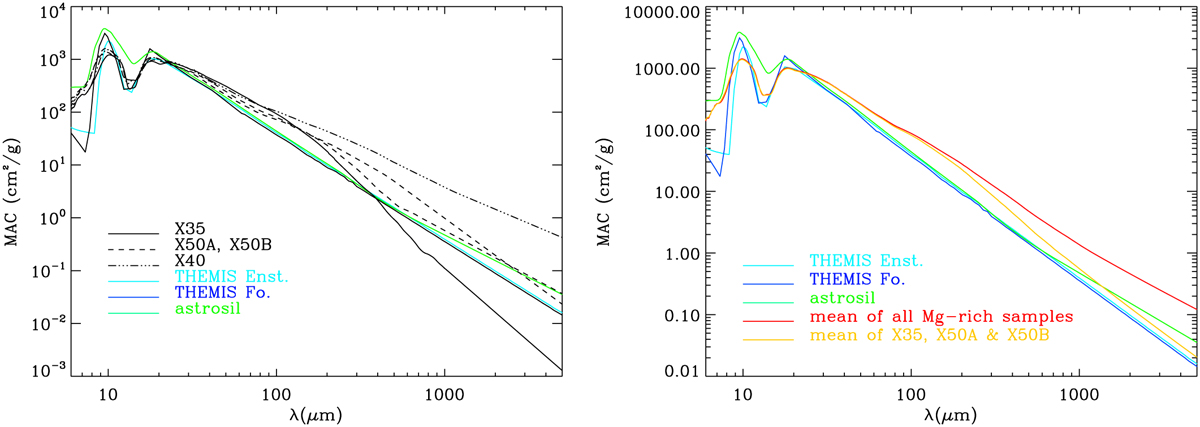
Comparison of the MAC for the silicate components of cosmic dust models with the MAC of the Mg-rich samples. The MACs are calculated for a prolate grain with an axis ratio a/b = 1.5 in the Rayleigh limit. Left panel: Astrosil (green line) and THEMIS (dark and light blue lines) compared with each of the four Mg-rich silicate samples (dark lines). Right panel: Astrosil (green line) and THEMIS (dark and light blue lines) compared with the average of the four Mg-rich samples (red line) and the average of the X35, X50A, and X50B samples (orange line).
Current usage metrics show cumulative count of Article Views (full-text article views including HTML views, PDF and ePub downloads, according to the available data) and Abstracts Views on Vision4Press platform.
Data correspond to usage on the plateform after 2015. The current usage metrics is available 48-96 hours after online publication and is updated daily on week days.
Initial download of the metrics may take a while.