Fig. 10
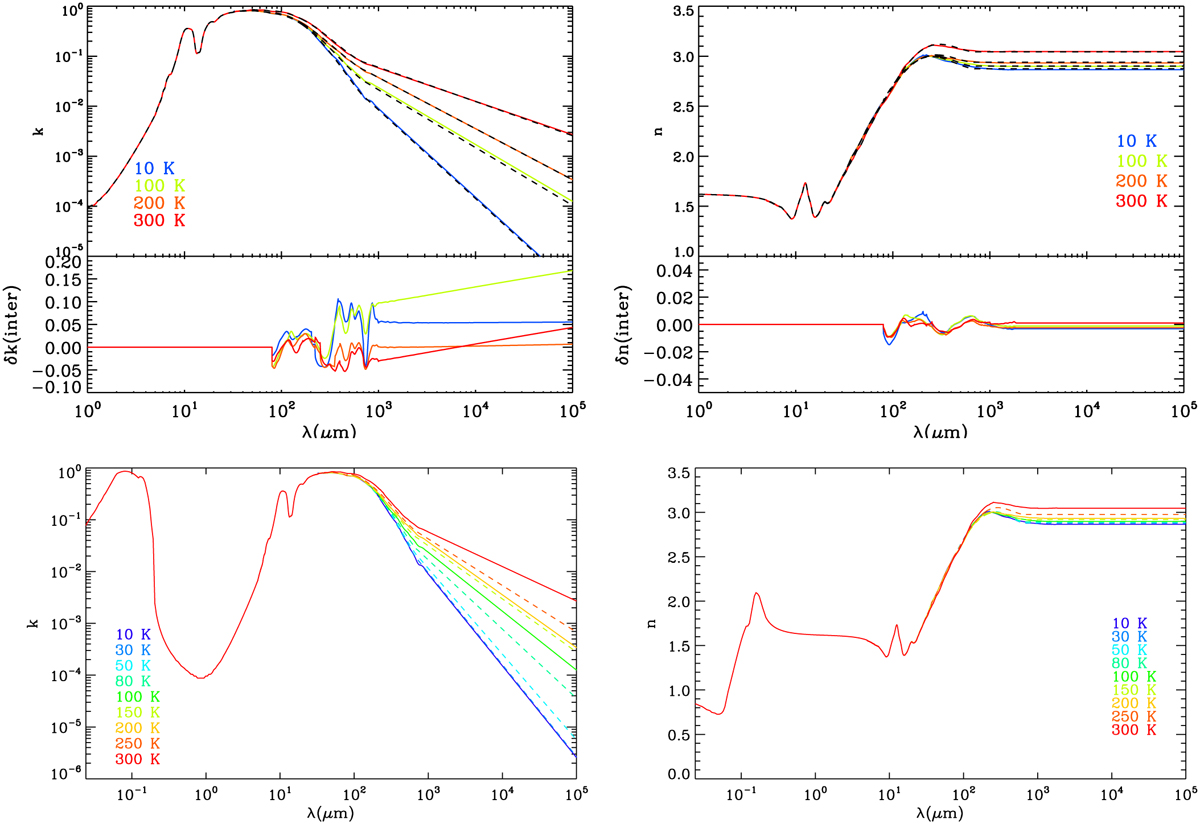
Download original image
Temperature interpolation of the optical constants for sample X35. The two upper panels show the comparison of k (upper left) and n (upper right) calculated from the measurements at 10, 100, 200, and 300 K (blue, green, orange, and red curves, respectively) with the interpolated ones (black dashed lines) together with their associated error. The two lower panels show k (lower left) and n (lower right) at temperatures from 10 K to 300 K. The interpolated optical constants are shown by the dashed lines and those calculated from measurements are the continuous lines.
Current usage metrics show cumulative count of Article Views (full-text article views including HTML views, PDF and ePub downloads, according to the available data) and Abstracts Views on Vision4Press platform.
Data correspond to usage on the plateform after 2015. The current usage metrics is available 48-96 hours after online publication and is updated daily on week days.
Initial download of the metrics may take a while.