Fig. 1
Download original image
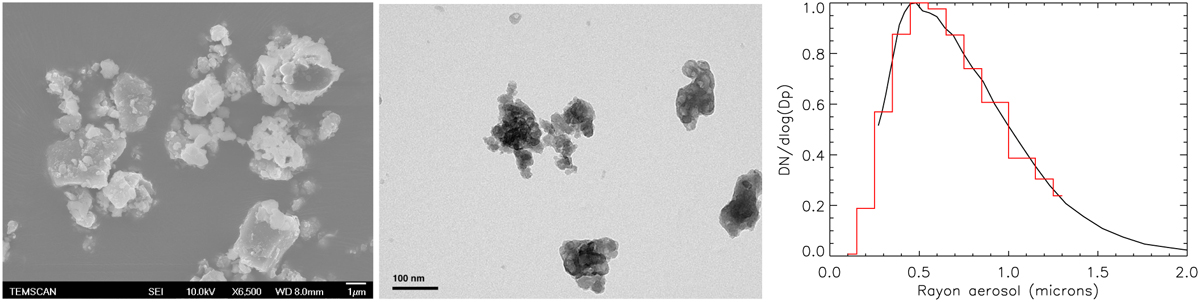
Sample sizes and shapes. Left panel: image of the glassy Mg-rich sample taken with a scanning electron microscope, the scale bar in the lower right is 1 µm. Middle panel: image of the solgel Fe-rich sample E20 taken with a transmission electron microscope, the scale bar is 100 nm. Right panel: black line shows the normalised size distribution measured for sample E30, Mg0.7 Fe0.3 SiO3. The red histogram-like curve shows the size distribution adopted in order to study the impact of the grain size distribution on the optical constants calculation (see Sect. 5).
Current usage metrics show cumulative count of Article Views (full-text article views including HTML views, PDF and ePub downloads, according to the available data) and Abstracts Views on Vision4Press platform.
Data correspond to usage on the plateform after 2015. The current usage metrics is available 48-96 hours after online publication and is updated daily on week days.
Initial download of the metrics may take a while.