Fig. 7

Download original image
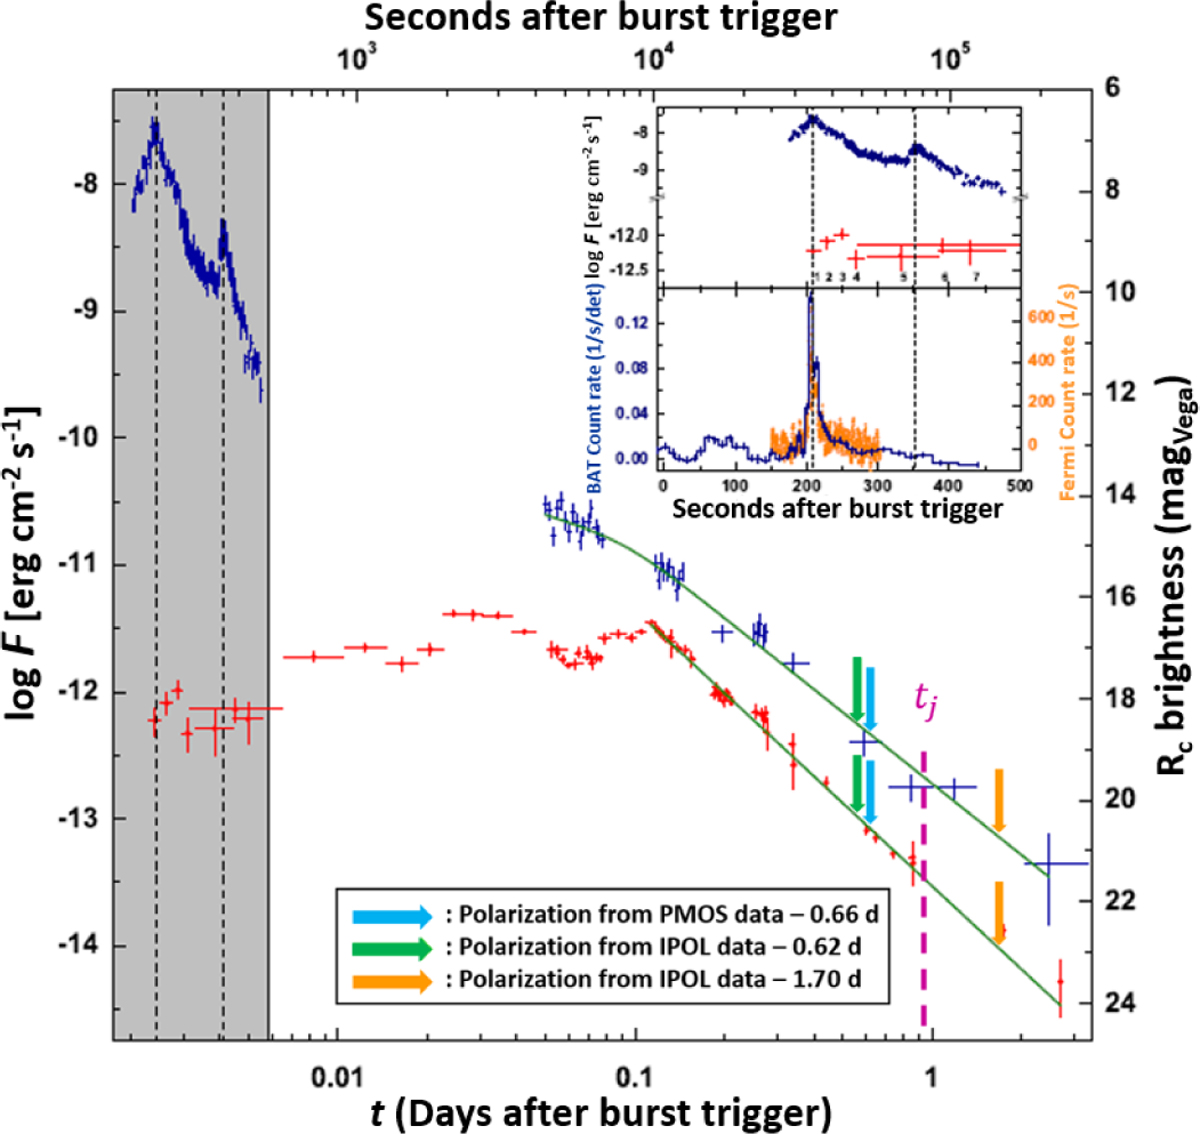
Optical (red points) and X-ray (blue bars, in 0.3−10 keV band) light curve of GRB 080928 afterglow. The green curve is the best fit of the late-time data, while the grey-shaded region on the left shows the early phase. The latter is also represented in the inset and compared with the prompt-phase emission detected by Fermi-GBM and Swift/BAT. The arrows above the best fit curves on the right represent the epochs of polarimetric observations obtained with ESO-VLT FORS1, both in the imaging polarimetry and spectro-polarimetry mode, and the assumed jet break time tj is indicated by the purple dashed line (Rossi et al. 2011).
Current usage metrics show cumulative count of Article Views (full-text article views including HTML views, PDF and ePub downloads, according to the available data) and Abstracts Views on Vision4Press platform.
Data correspond to usage on the plateform after 2015. The current usage metrics is available 48-96 hours after online publication and is updated daily on week days.
Initial download of the metrics may take a while.


