Fig. 5

Download original image
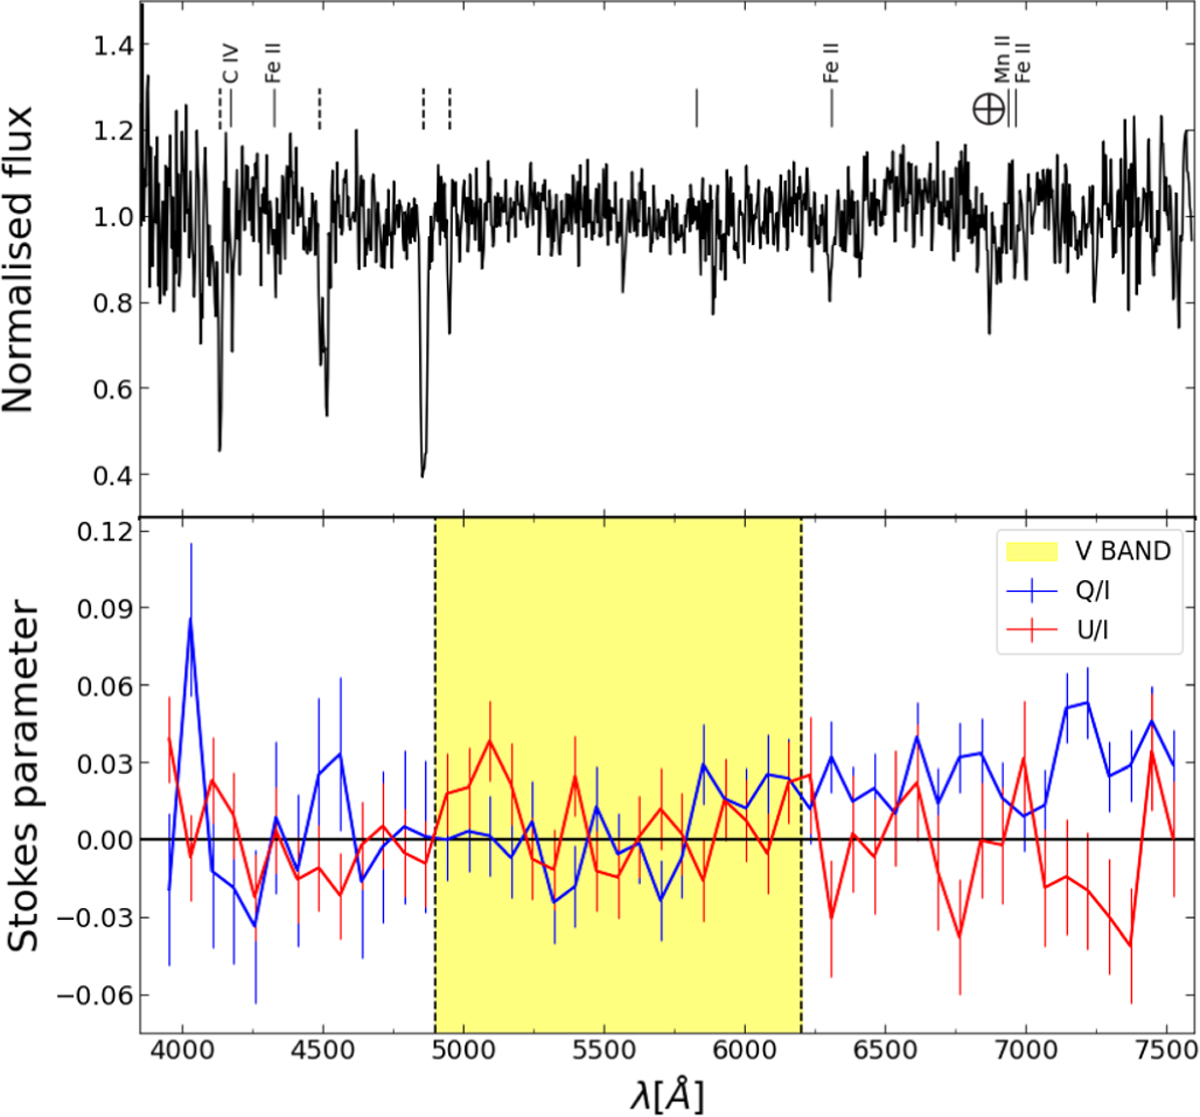
Results of GRB 080928 spectroscopic analysis. Top: GRB 080928 normalised spectrum obtained from FORS1/PMOS data taken from t ~ 14.95 h after the burst on 2008 September 28. Spectral lines from GRB 080928 absorption system at z = 1.6919 are marked with vertical solid lines, while the ones from an intervening system at z=0.7359 are represented by vertical dashed lines (for details, see Fynbo et al. 2009). Bottom: Q/I, U/I Stokes parameters spectra derived from FORS1/PMOS data. The highlighted yellow region corresponds to the V-band in which IPOL data were taken in order to perform a consistent comparison between data taken with the two observing modes. The spectra have been rebinned as described in the text.
Current usage metrics show cumulative count of Article Views (full-text article views including HTML views, PDF and ePub downloads, according to the available data) and Abstracts Views on Vision4Press platform.
Data correspond to usage on the plateform after 2015. The current usage metrics is available 48-96 hours after online publication and is updated daily on week days.
Initial download of the metrics may take a while.


