Fig. 3

Download original image
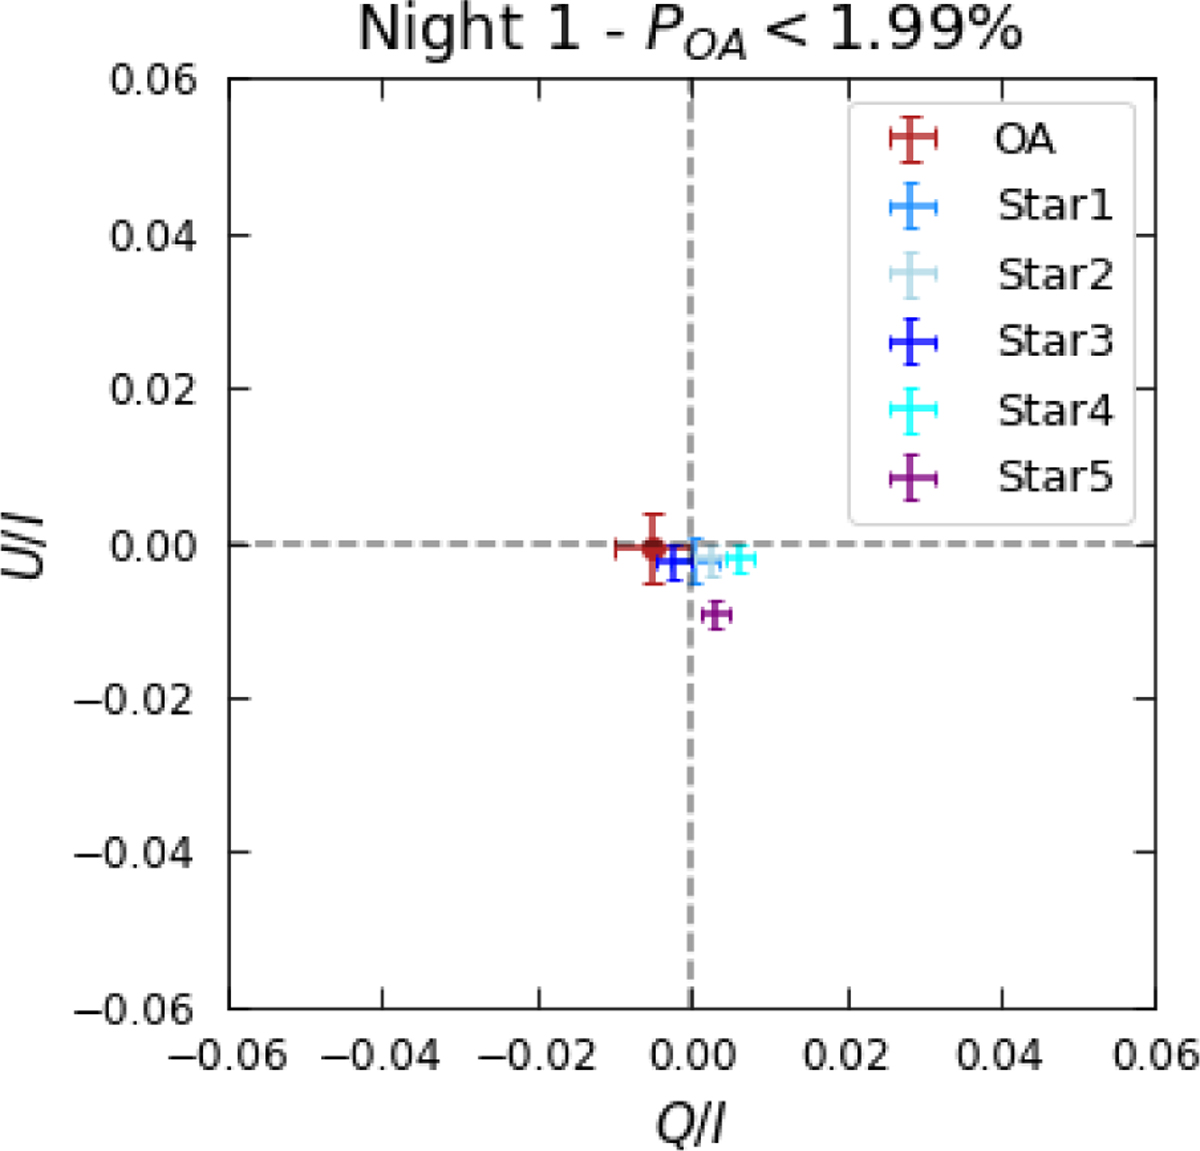
Q/I, U/I plot from the IPOL observation on the night of 2008 September 28. The position of the optical afterglow (red bars) does not differ markedly from the other points, which represent some bright field stars observed near the transient and expected to be unpolarised. Therefore, the polarisation of the OA is consistent with zero, and only a 3σ upper limit is given (see value above the plot).
Current usage metrics show cumulative count of Article Views (full-text article views including HTML views, PDF and ePub downloads, according to the available data) and Abstracts Views on Vision4Press platform.
Data correspond to usage on the plateform after 2015. The current usage metrics is available 48-96 hours after online publication and is updated daily on week days.
Initial download of the metrics may take a while.


