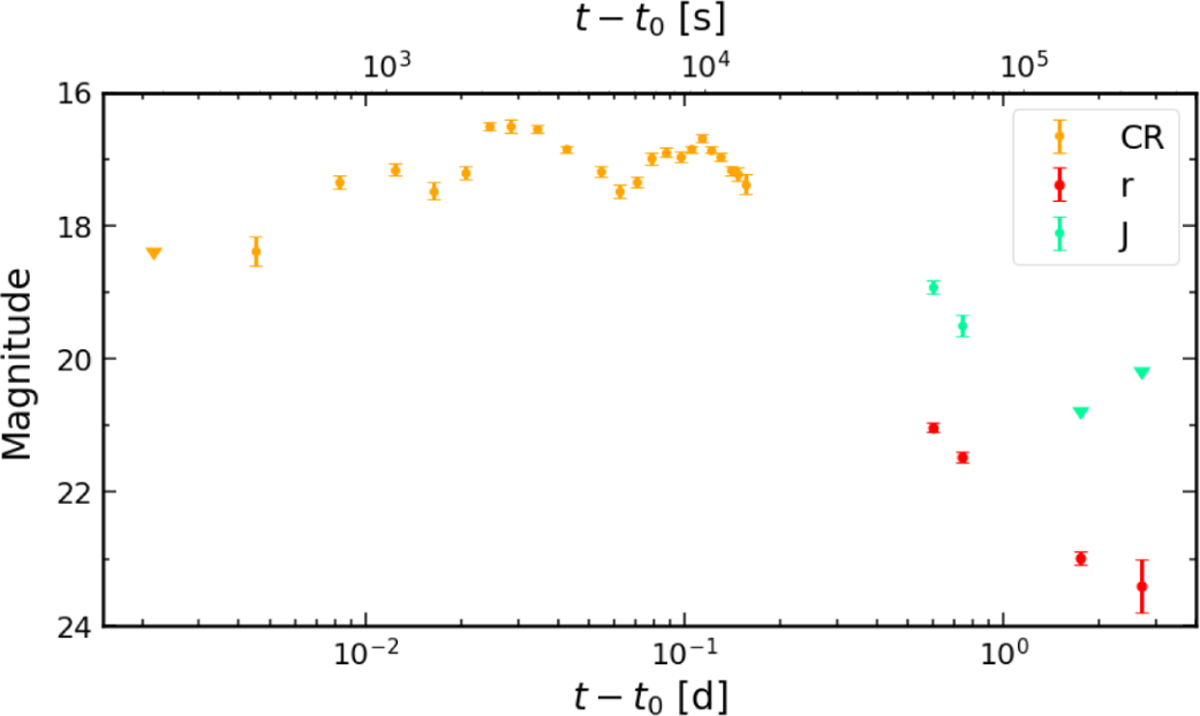
Fig. 2

Download original image
R-band and J-band points from the complete data set shown in Fig. 1, without shift in magnitude, to show the temporal evolution of the optical-NIR afterglow of GRB 080928. Optical r-band flux is nearly constant up to t − t0 ~ 10−1 days, before it decreases as expected for standard afterglows; NIR J-band observations show a similar decrease even if two points and only two upper limits were obtained.
Current usage metrics show cumulative count of Article Views (full-text article views including HTML views, PDF and ePub downloads, according to the available data) and Abstracts Views on Vision4Press platform.
Data correspond to usage on the plateform after 2015. The current usage metrics is available 48-96 hours after online publication and is updated daily on week days.
Initial download of the metrics may take a while.


