Fig. 8.
Download original image
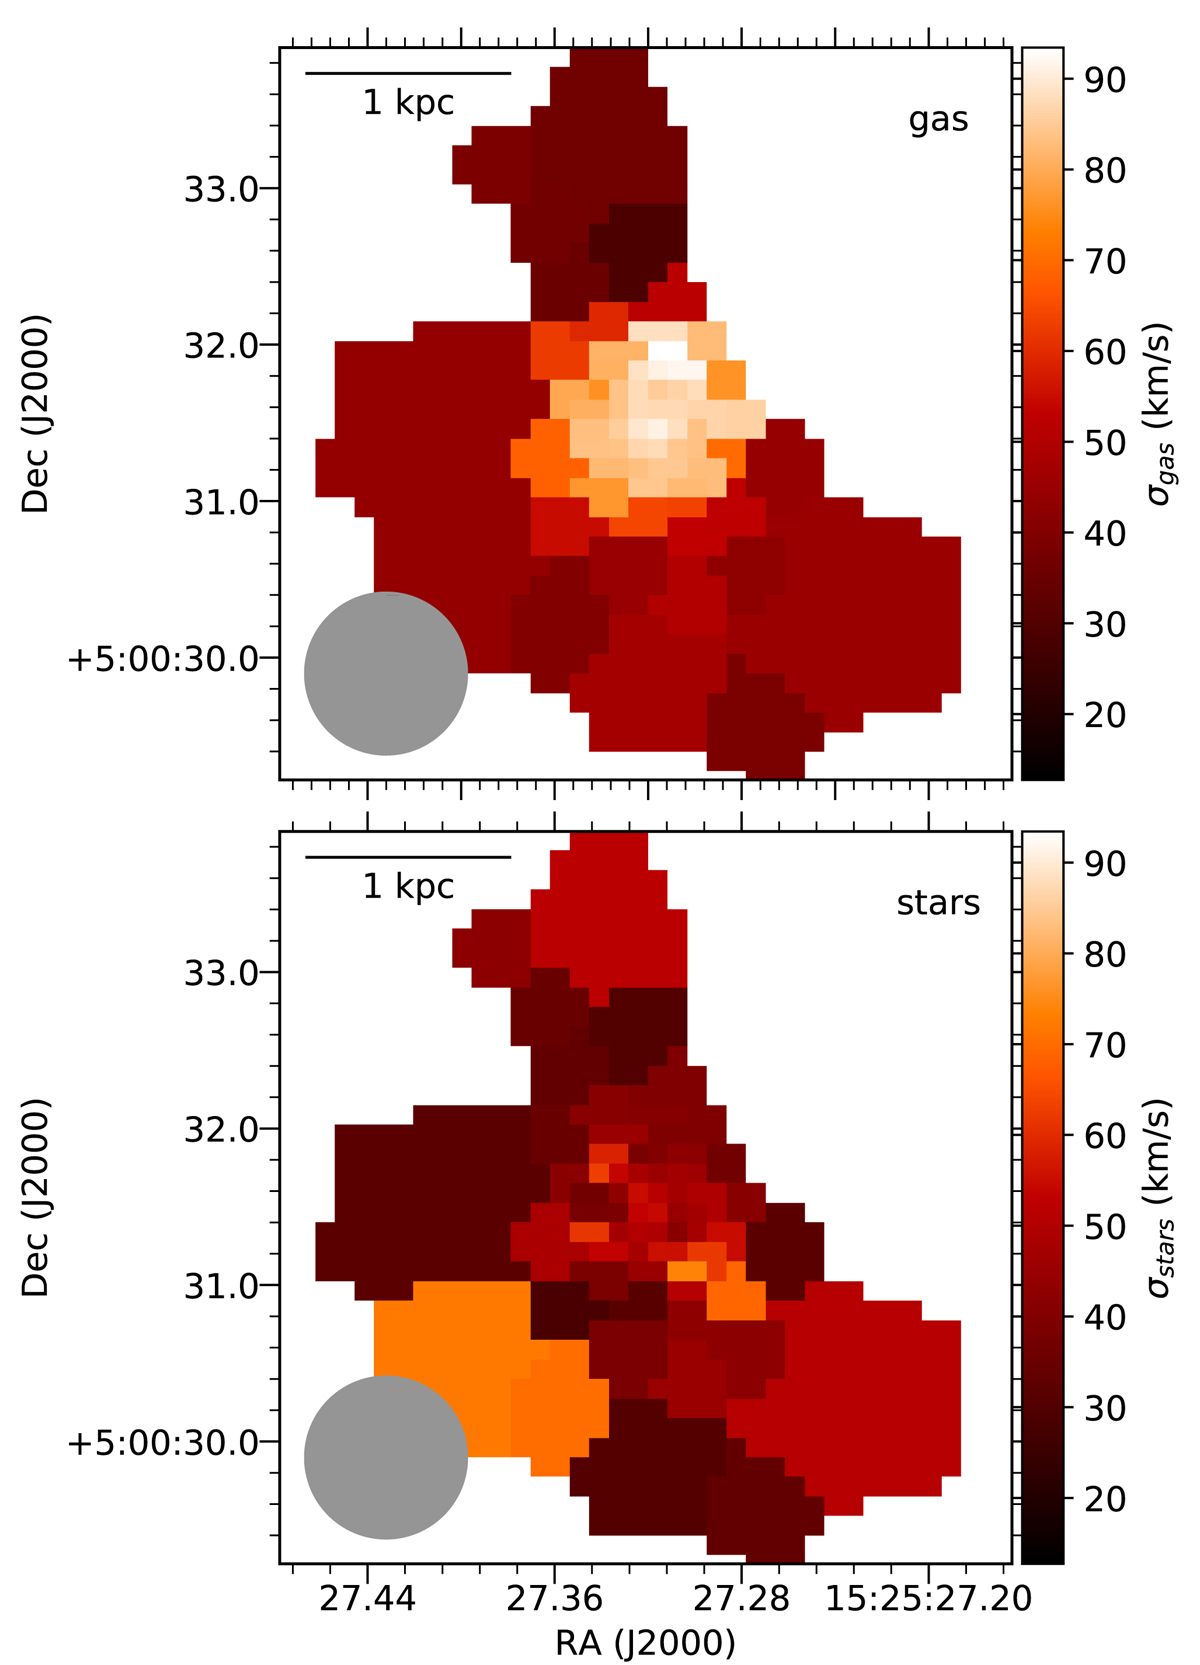
Velocity dispersion (σ) maps from the gas (top) and stars (bottom) for J1525+0500, showing a clear difference in the central area of the galaxy between the stellar and gas velocity dispersion. The grey circle represents the FWHM of the observed PSF as derived in Sect. 5.1. The 1 kpc scale bar at the top is derived using the observed redshift and the cosmological parameters of Planck Collaboration XIII (2016).
Current usage metrics show cumulative count of Article Views (full-text article views including HTML views, PDF and ePub downloads, according to the available data) and Abstracts Views on Vision4Press platform.
Data correspond to usage on the plateform after 2015. The current usage metrics is available 48-96 hours after online publication and is updated daily on week days.
Initial download of the metrics may take a while.