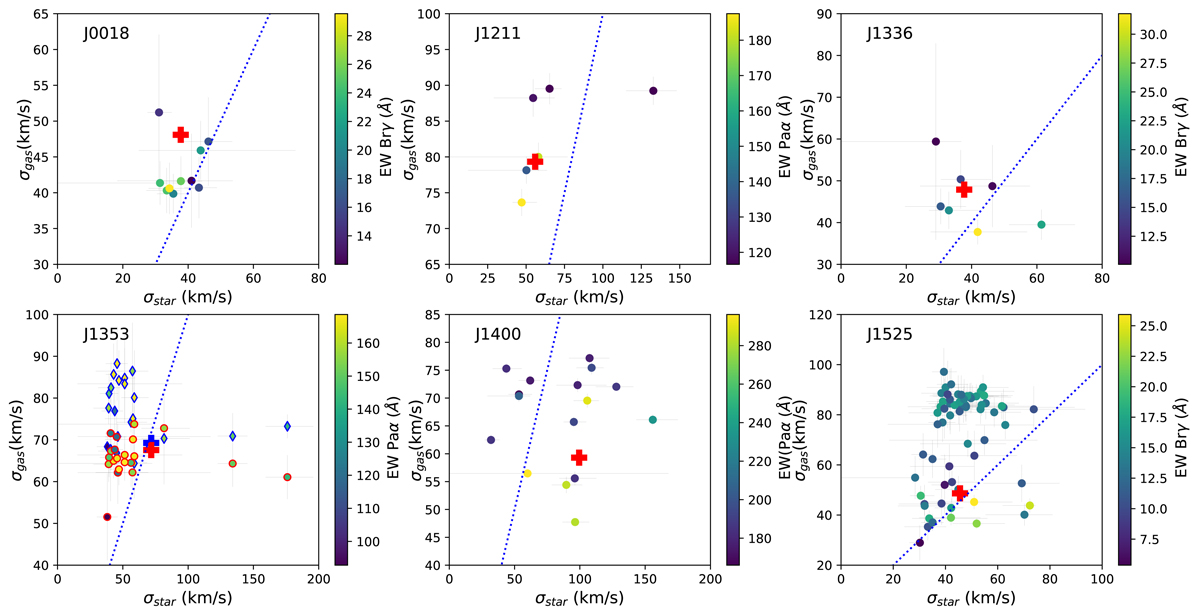
Fig. 7.
Download original image
Velocity dispersion of the gas (σgas) versus that of the stars (σstars) of six galaxies with sufficient continuum S/N. The blue dashed line is the one-to-one line. Each data point represents a Voronoi cell. The colour coding represents the Equivalent Width of the Paα or Brγ emission line in the Voronoi cell. For J1353 the blue-shifted nebular emission plotted as diamond shapes with a blue edge and the redshifted emission with circles with a red edge. The plus signs represent the relation between the averaged σgas and σstar.
Current usage metrics show cumulative count of Article Views (full-text article views including HTML views, PDF and ePub downloads, according to the available data) and Abstracts Views on Vision4Press platform.
Data correspond to usage on the plateform after 2015. The current usage metrics is available 48-96 hours after online publication and is updated daily on week days.
Initial download of the metrics may take a while.