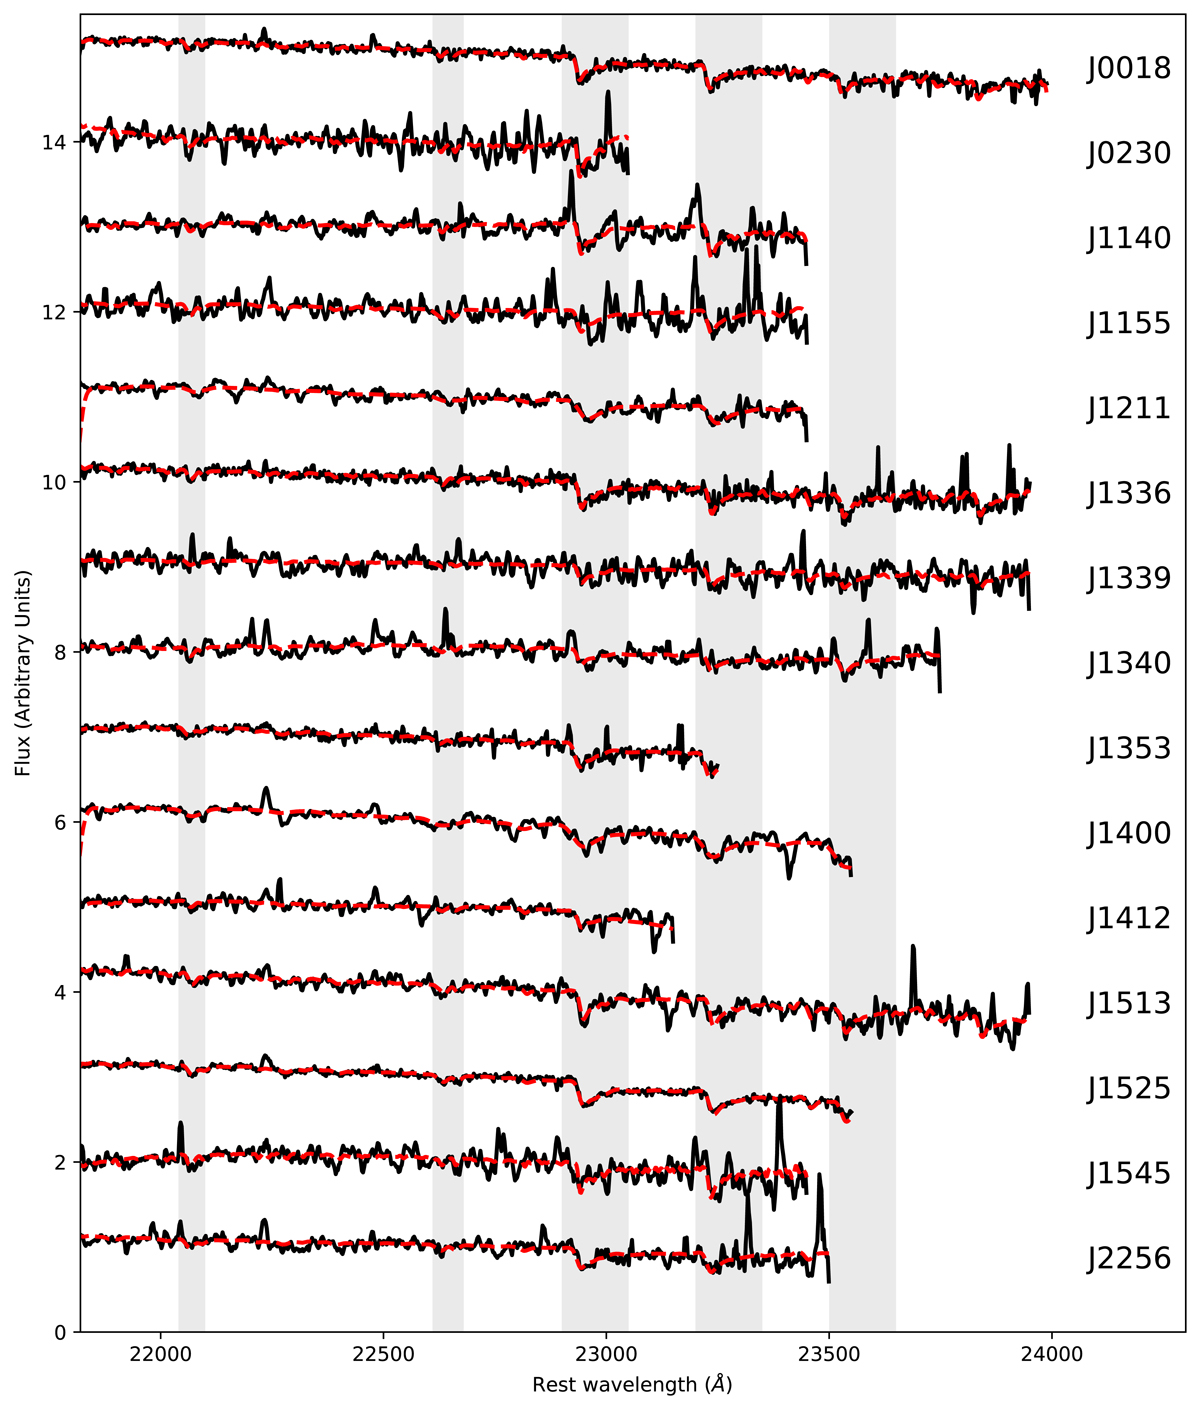
Fig. 4.
Download original image
Integrated K-band spectra, corrected for their redshift between 2.18 and 2.4 μm, the wavelength range over which the pPXF fit was performed. The spectra are divided by the flux scaling factor determined by pPXF to match the template spectra to the observed spectra. This approximately scales the spectra by the median flux. For display purposes the spectra are shifted after that by adding 1 between each spectrum. No strong emission lines are present in this wavelength range. The spectra are smoothed with a 3 pixel boxcar filter. Only the spectra of J0018, J1336 and J1525 are not smoothed. The red-dashed lines are the best pPXF fits. Highlighted in grey are the strongest absorption bands in this part of the spectrum: Na I, λrest = 2.206 μm, Ca I, λrest = 2.26 μm, and the CO overtone absorption bands red wards of 2.29 μm (Rayner et al. 2009).
Current usage metrics show cumulative count of Article Views (full-text article views including HTML views, PDF and ePub downloads, according to the available data) and Abstracts Views on Vision4Press platform.
Data correspond to usage on the plateform after 2015. The current usage metrics is available 48-96 hours after online publication and is updated daily on week days.
Initial download of the metrics may take a while.