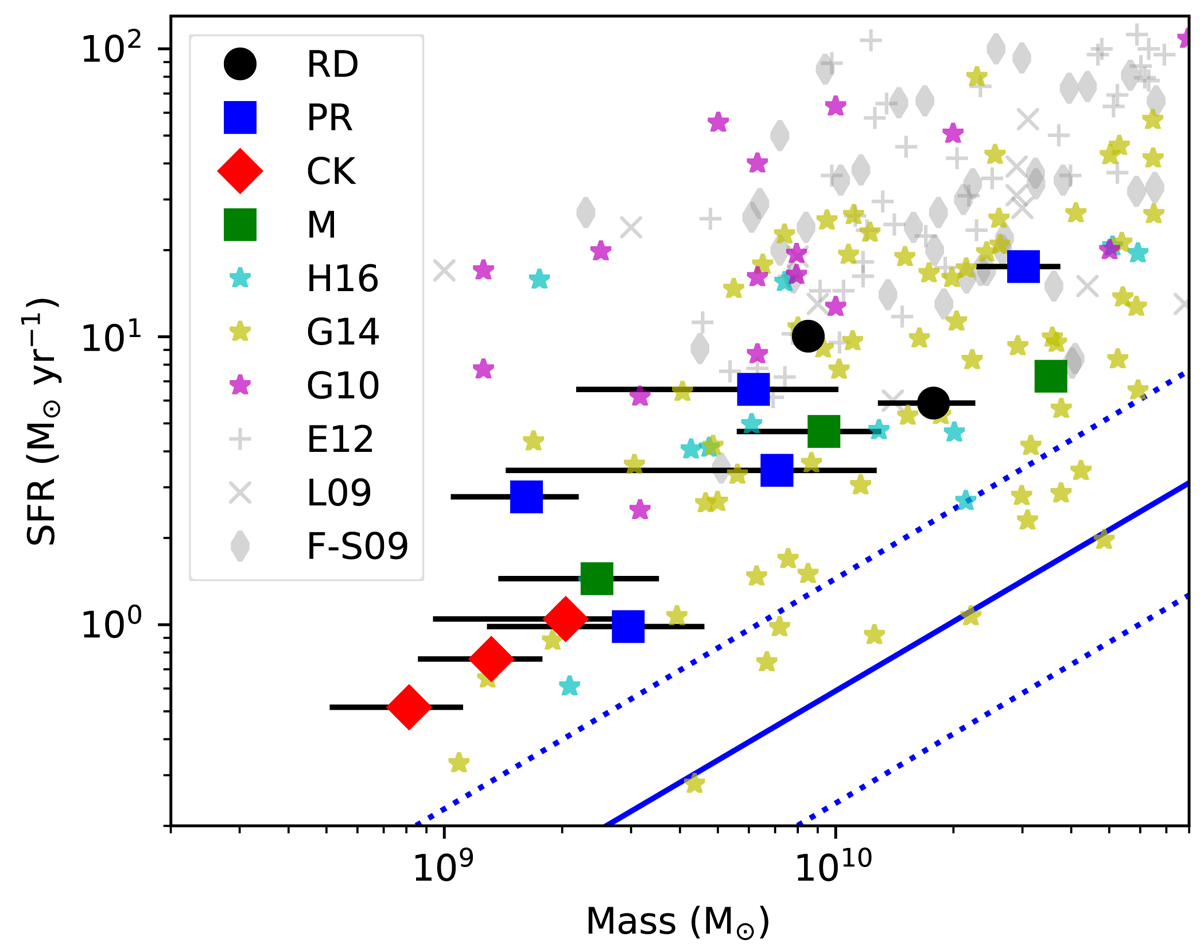
Fig. 2.
Download original image
Star formation rate versus galaxy mass diagram. The star formation rates are corrected for extinction derived from Hα/Hβ and are corrected for the missing flux outside the 3″ SDSS fibre, derived from the emission line maps in our SINFONI data. The symbols represent their morphological classification introduced in Sect. 5.1: (RD, rotating disks: black circles, PR, perturbed rotators: blue squares, CK, complex kinematics: red diamonds, M, mergers: green squares). Over-plotted are sample from the literature (Table 3). The low redshift samples shown are LARS, cyan asterisk (Herenz et al. 2016; Hayes et al. 2014; Guaita et al. 2015, H16), LBA analogues; magenta asterisk (Gonçalves et al. 2010, G10) and the DYNAMO sample, yellow asterisk (Green et al. 2014, G14). The high redshift sample are plotted as grey plus signs for MASSIV (Epinat et al. 2012; Contini et al. 2012, E12), grey crosses for (Law et al. 2009, L09) and grey diamonds for SINS (Förster-Schreiber et al. 2009, F-S09). The blue solid line is the star formation main-sequence derived by Chang et al. (2015) with their 1σ scatter (0.39 dex) plotted as blue dashed lines.
Current usage metrics show cumulative count of Article Views (full-text article views including HTML views, PDF and ePub downloads, according to the available data) and Abstracts Views on Vision4Press platform.
Data correspond to usage on the plateform after 2015. The current usage metrics is available 48-96 hours after online publication and is updated daily on week days.
Initial download of the metrics may take a while.