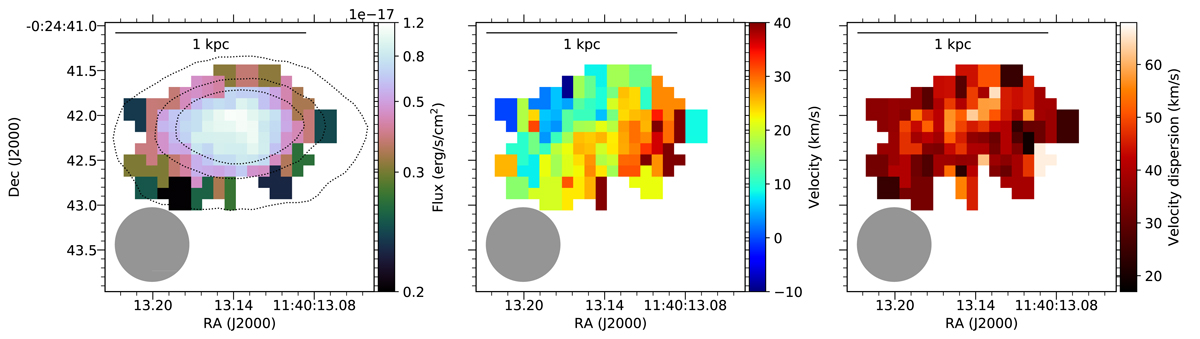
Fig. A.1.
Download original image
Spatially resolved maps of the Brγ emission line of J1140-0024. Left: Brγ intensity map with as contours the Ks band continuum flux created by convolving the datacube with the 2MASS Ks response curve. The grey circle represents the FWHM of the observed PSF as derived in Sect. 5.1. The 1 kpc scale bar at the top is derived using the observed redshift and the cosmological parameters of Planck Collaboration XIII (2016). Middle: Brγ velocity map constructed from a single Gaussian fit. Right: Observed velocity dispersion map corrected for the instrumental resolution. This map is not corrected for beam smearing (Sect. 5.1). As the beam smearing correction only has a minor effect on the velocity dispersion maps we have chosen to show the observed maps before correction.
Current usage metrics show cumulative count of Article Views (full-text article views including HTML views, PDF and ePub downloads, according to the available data) and Abstracts Views on Vision4Press platform.
Data correspond to usage on the plateform after 2015. The current usage metrics is available 48-96 hours after online publication and is updated daily on week days.
Initial download of the metrics may take a while.