Fig. 15.
Download original image
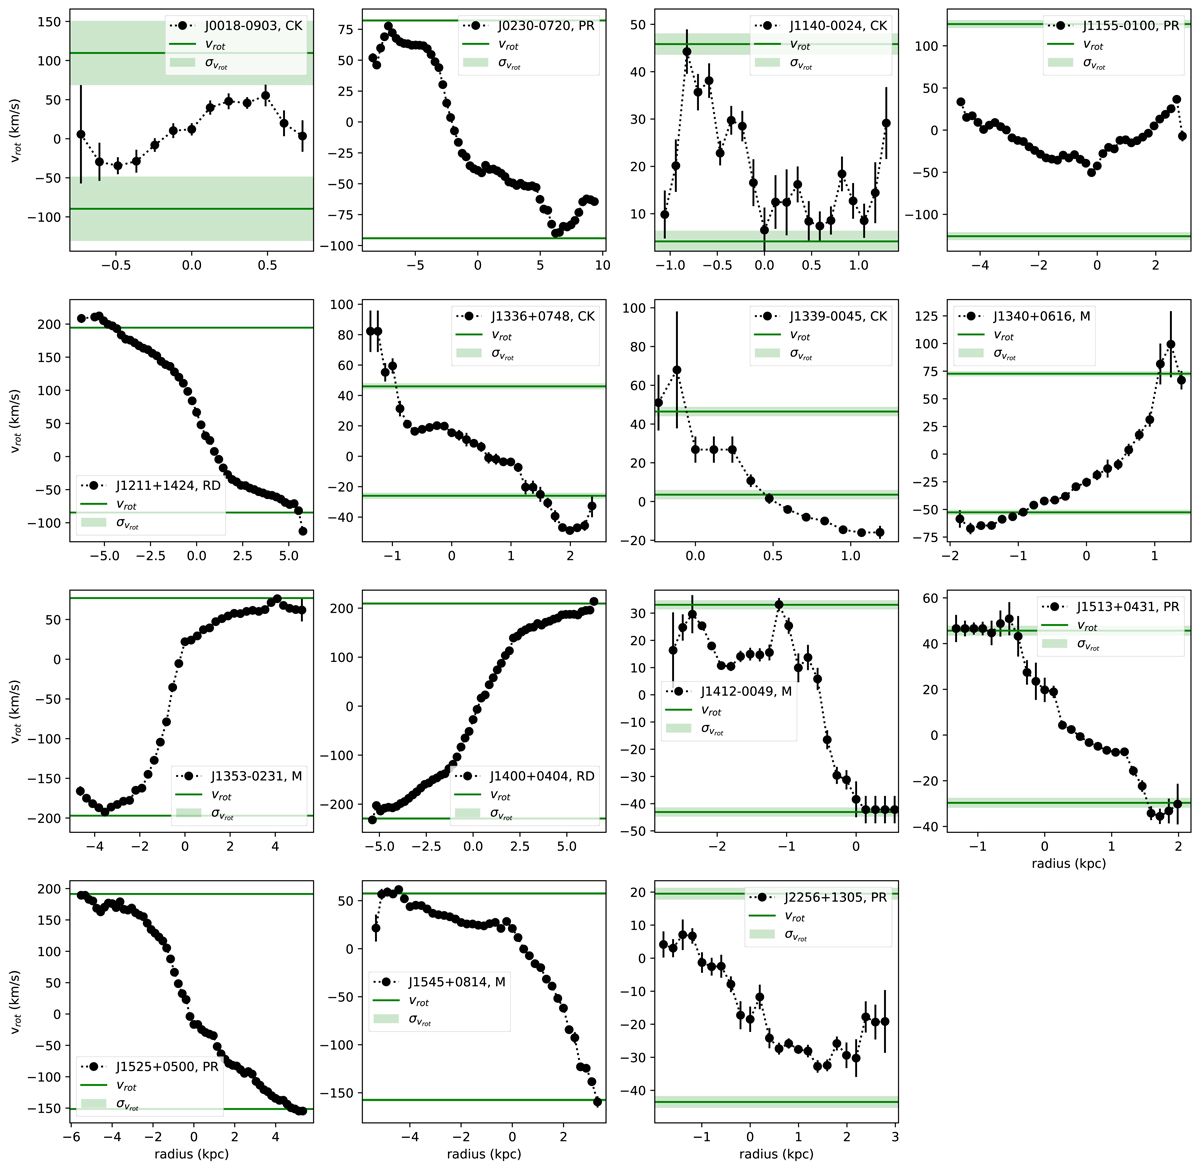
Velocity profiles galaxies derived by radially averaging a 30° cone around the position angle derived from the SDSS images. The velocities are corrected for the inclination of the galaxies. The green lines show + and − vrot (Table 8). The values for vrot are shifted so they are symmetric around the observed velocity profiles. The shaded green areas show the errors on vrot. Their classification as derived in Sect. 5.1 is given.
Current usage metrics show cumulative count of Article Views (full-text article views including HTML views, PDF and ePub downloads, according to the available data) and Abstracts Views on Vision4Press platform.
Data correspond to usage on the plateform after 2015. The current usage metrics is available 48-96 hours after online publication and is updated daily on week days.
Initial download of the metrics may take a while.