Fig. 14.
Download original image
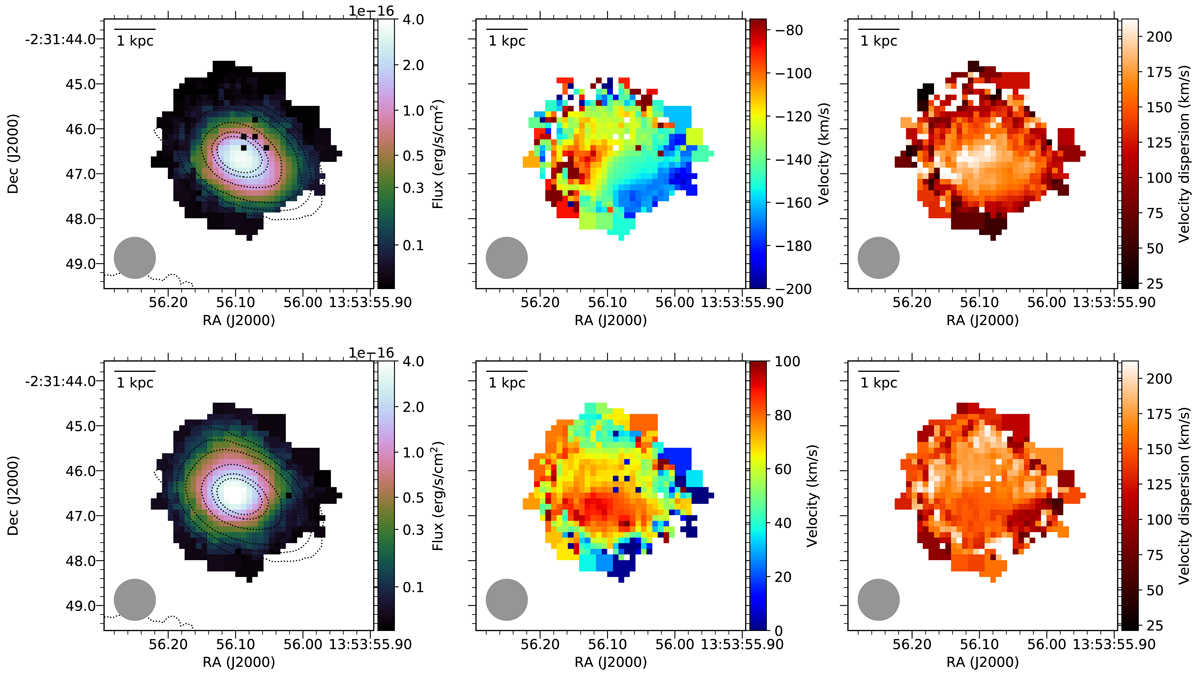
Spatially resolved maps of the blue- (top panel) and red component of the Paα line of J1353. The first column shows the integrated flux of the Gaussian component. The contours in the flux maps are the contours of the Ks image. The middle column the velocity with respect to the redshift used in Table 1 and in the last column the velocity dispersion is shown. The instrumental broadening is removed from the dispersion.
Current usage metrics show cumulative count of Article Views (full-text article views including HTML views, PDF and ePub downloads, according to the available data) and Abstracts Views on Vision4Press platform.
Data correspond to usage on the plateform after 2015. The current usage metrics is available 48-96 hours after online publication and is updated daily on week days.
Initial download of the metrics may take a while.