Fig. 13.
Download original image
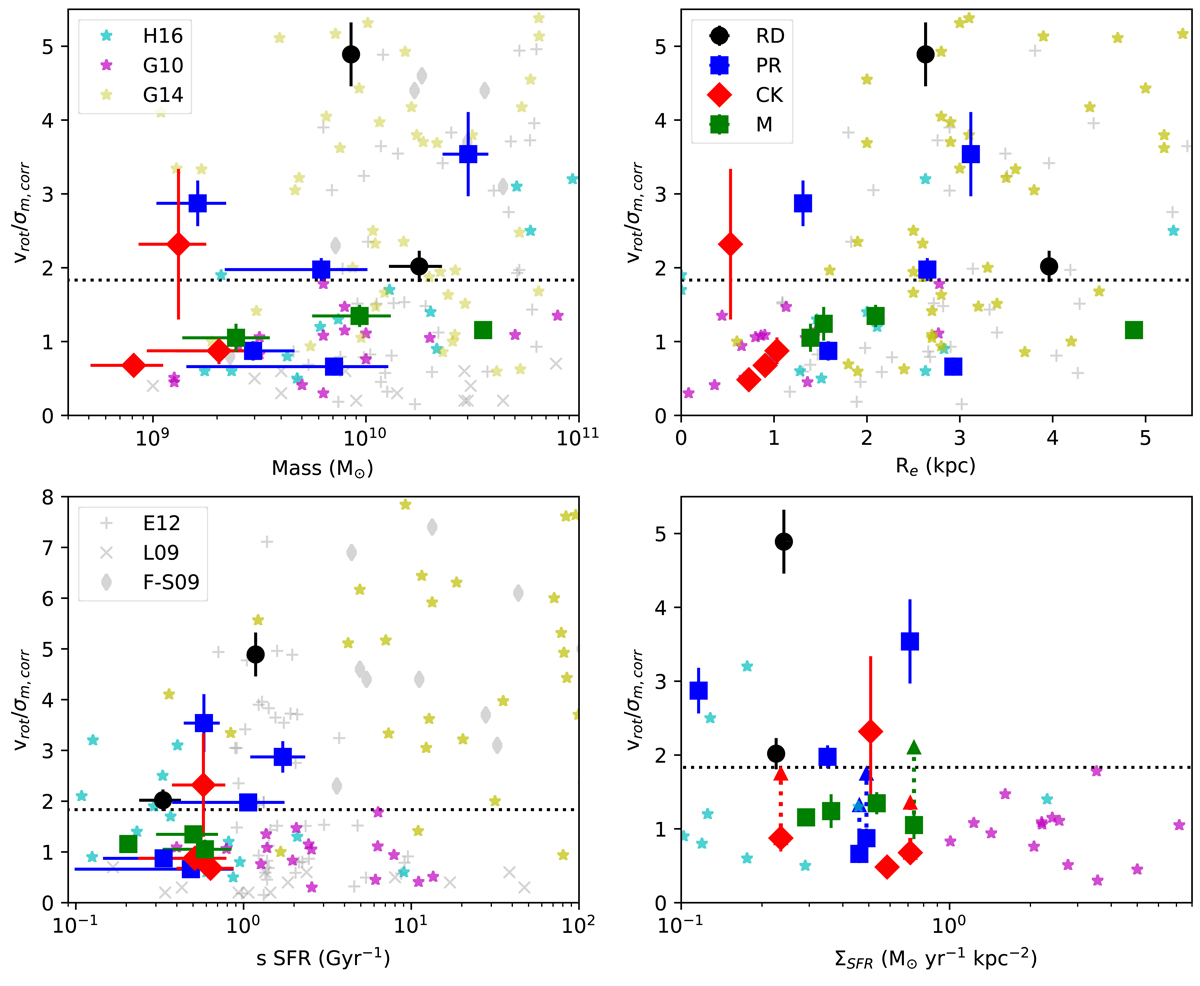
v/σm, corr versus galaxy mass (top left) and effective radius (Re, top right), specific star formation rate (sSFR, bottom left) and the surface density of star formation rate (ΣSFR, bottom right). Both the sSFR and ΣSFR are corrected for extinction. The colours and symbol signs are the same as in Fig. 12. Two galaxies, J1140 and J1340 are missing in the top- and bottom-left plots, as no masses are derived in the SDSS database. The vertical dotted lines in the bottom right panel are those galaxies where the Paα or Brγ emission does not cover the entire galaxy, therefore potentially resulting in underestimating vrot. The location of the triangle shows the position of the galaxies with 2 times higher vrot (Sect. 6.1). The horizontal dotted line shows the deviation between dispersion and rotationally dominated galaxies (![]() , Schreiber & Wuyts 2020). Over-plotted are sample from the literature, with symbols identical to Fig. 2.
, Schreiber & Wuyts 2020). Over-plotted are sample from the literature, with symbols identical to Fig. 2.
Current usage metrics show cumulative count of Article Views (full-text article views including HTML views, PDF and ePub downloads, according to the available data) and Abstracts Views on Vision4Press platform.
Data correspond to usage on the plateform after 2015. The current usage metrics is available 48-96 hours after online publication and is updated daily on week days.
Initial download of the metrics may take a while.