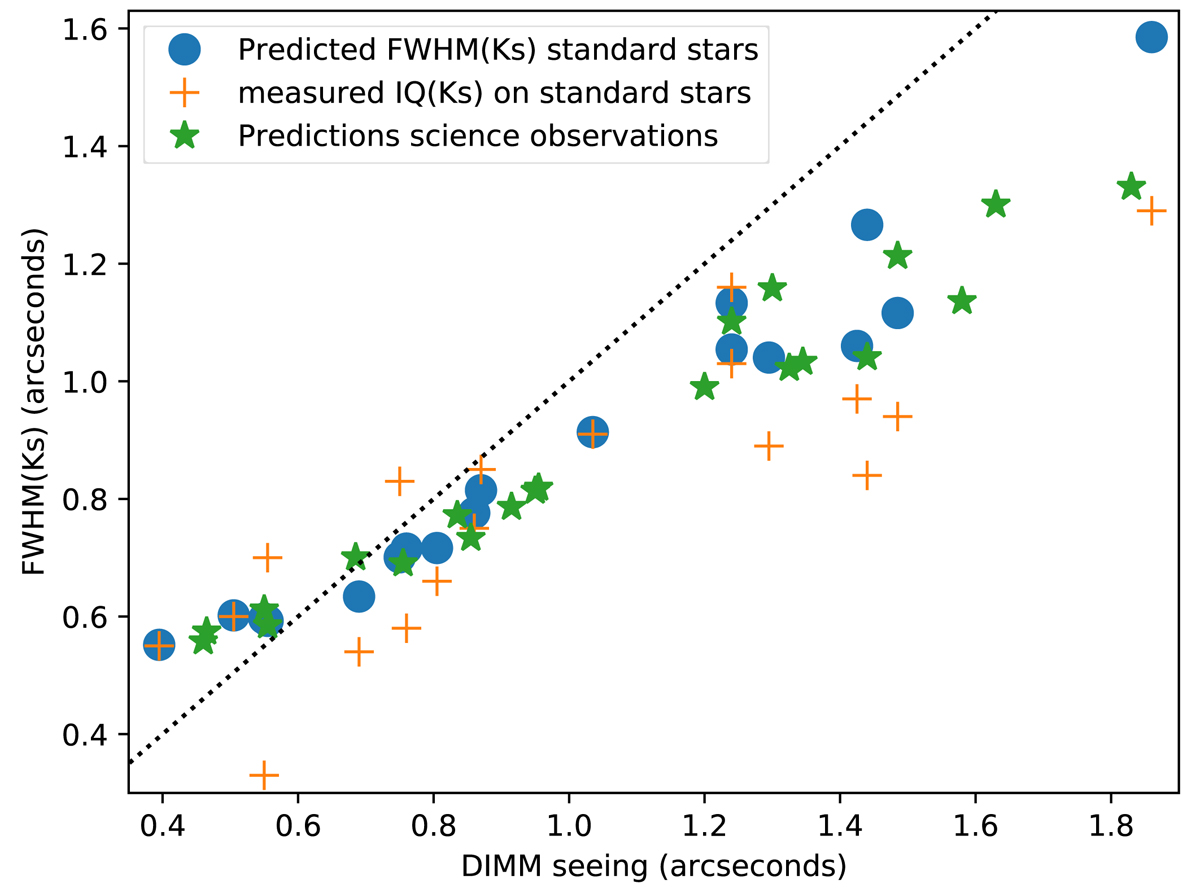
Fig. 11.
Download original image
Prediction of the image quality of the data cubes of the galaxies based on the airmass and DIMM seeing vs the DIMM seeing. The plus signs show the measured image quality in the reduced cubes of the standard star observations plotted vs the DIMM seeing in the fits headers. The filled circles show the predicted IQ using the formulas from the ETC with the airmass and DIMM seeing from the fits headers. The star signs show the predicted IQ values for the science observations. The dotted line shows the one-to-one relation.
Current usage metrics show cumulative count of Article Views (full-text article views including HTML views, PDF and ePub downloads, according to the available data) and Abstracts Views on Vision4Press platform.
Data correspond to usage on the plateform after 2015. The current usage metrics is available 48-96 hours after online publication and is updated daily on week days.
Initial download of the metrics may take a while.