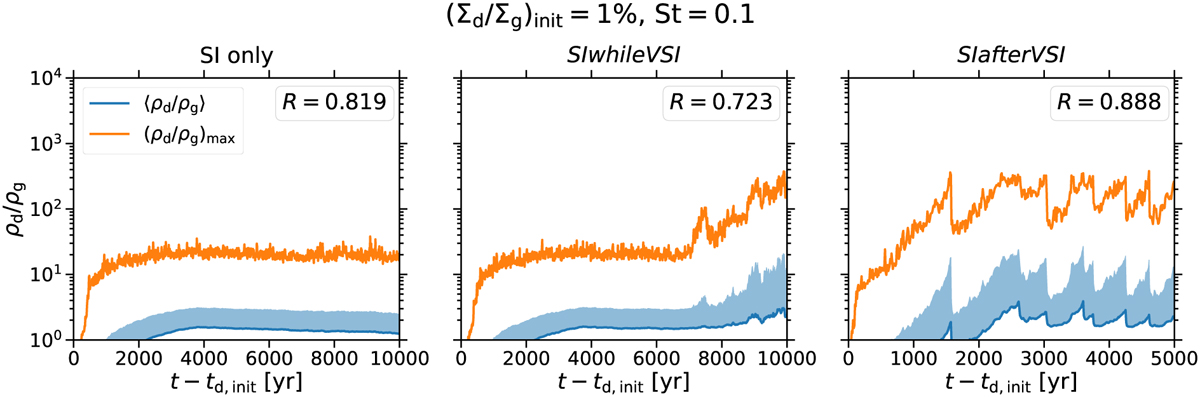
Fig. 7
Download original image
Maximum (orange lines) as well as dust-mass-weighted average (blue lines) and standard deviation (blue-shaded areas) of dust-to-gas volume density ratio ρd/ρg as a function of time after the dust particle initialisation t – td,init The maximum, mean, and standard deviation are well-correlated, with the Pearson correlation coefficients6 of maximum and mean being given in the top right of the panels. Three phases in the evolution of the volume density ratio in the SIwhileVSI simulation can be distinguished: an initial phase of sedimentation, followed by a quasi-steady phase, and a phase of strong clumping characterised by strong variations. In comparison, the simulation of the streaming instability never evolves into the strong-clumping phase, while the SIafterVSI simulation skips the quasi-steady phase.
Current usage metrics show cumulative count of Article Views (full-text article views including HTML views, PDF and ePub downloads, according to the available data) and Abstracts Views on Vision4Press platform.
Data correspond to usage on the plateform after 2015. The current usage metrics is available 48-96 hours after online publication and is updated daily on week days.
Initial download of the metrics may take a while.