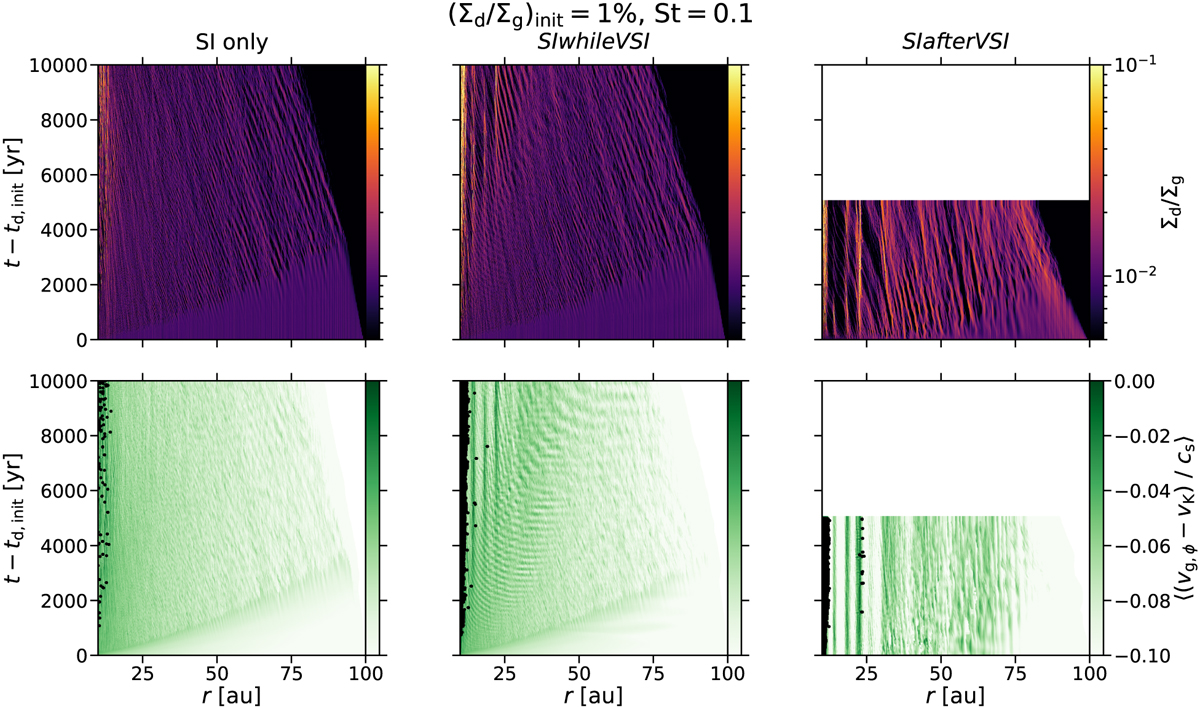
Fig. 4
Download original image
Ratio of dust Σd to gas surface density Σg (upper panels) and difference between azimuthal gas velocity υg,ϕ and Keplerian velocity υK (lower panels). Both quantities are depicted as a function of radius r and time t after the initialisation of the dust particles at td,init. The velocity difference is averaged over the vertical domain size, weighted by the dust mass, and expressed as a Mach number. In the absence of turbulence, this quantity is equal to the negative of the parameter Π as defined in Eq. (8). Black dots indicate that the azimuthal velocity is equal to or greater than the Keplerian velocity. Enhancements in the dust-to-gas surface density ratio and in the difference between azimuthal gas velocity and Keplerian velocity are larger at late times (t – td,init > 5 kyr) and small radii (r < 40 au) in SIwhileVSI than in the simulation of the streaming instability in isolation, and greatest at all times and radii in SIafterVSI. Surface density ratio and velocity difference can be seen to generally be correlated.
Current usage metrics show cumulative count of Article Views (full-text article views including HTML views, PDF and ePub downloads, according to the available data) and Abstracts Views on Vision4Press platform.
Data correspond to usage on the plateform after 2015. The current usage metrics is available 48-96 hours after online publication and is updated daily on week days.
Initial download of the metrics may take a while.