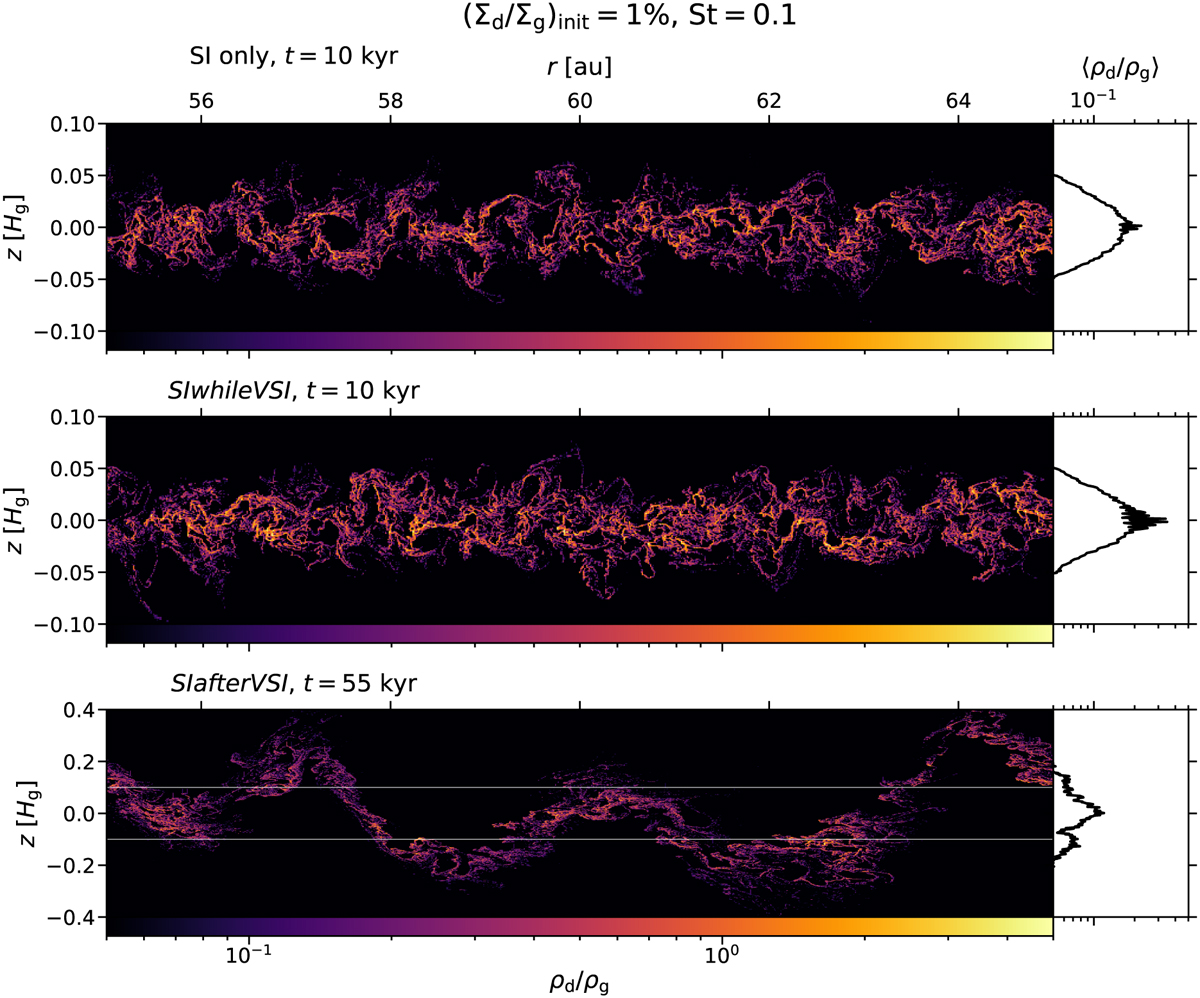
Fig. 3
Download original image
Ratio of dust ρd to gas volume density ρg as a function of radius r and height z, the latter given in units of gas scale heights Hg (left panels). The average over the radius range shown in the left panels is depicted as a function of height in the right panels. The top, middle, and lower panels show the dust-to-gas volume density ratio at the end of simulations of the streaming instability in isolation, the scenario SIwhileVSI, and the scenario SIafterVSI, respectively, with an initial dust-to-gas surface density ratio of 1% and a Stokes number of 0.1. The horizontal white lines in the lower panel illustrate the range of heights depicted in the upper and middle panels. In all simulations, local maxima of the volume density ratio are distributed over the entire vertical dimension of the dust layer. While the vertical dust distribution in the simulations of the streaming instability only and of the scenario SIwhileVSI is largely Gaussian, the dust layer possesses the form of a wave rather than a Gaussian shape in the SIafterVSI simulation.
Current usage metrics show cumulative count of Article Views (full-text article views including HTML views, PDF and ePub downloads, according to the available data) and Abstracts Views on Vision4Press platform.
Data correspond to usage on the plateform after 2015. The current usage metrics is available 48-96 hours after online publication and is updated daily on week days.
Initial download of the metrics may take a while.