Fig. 11
Download original image
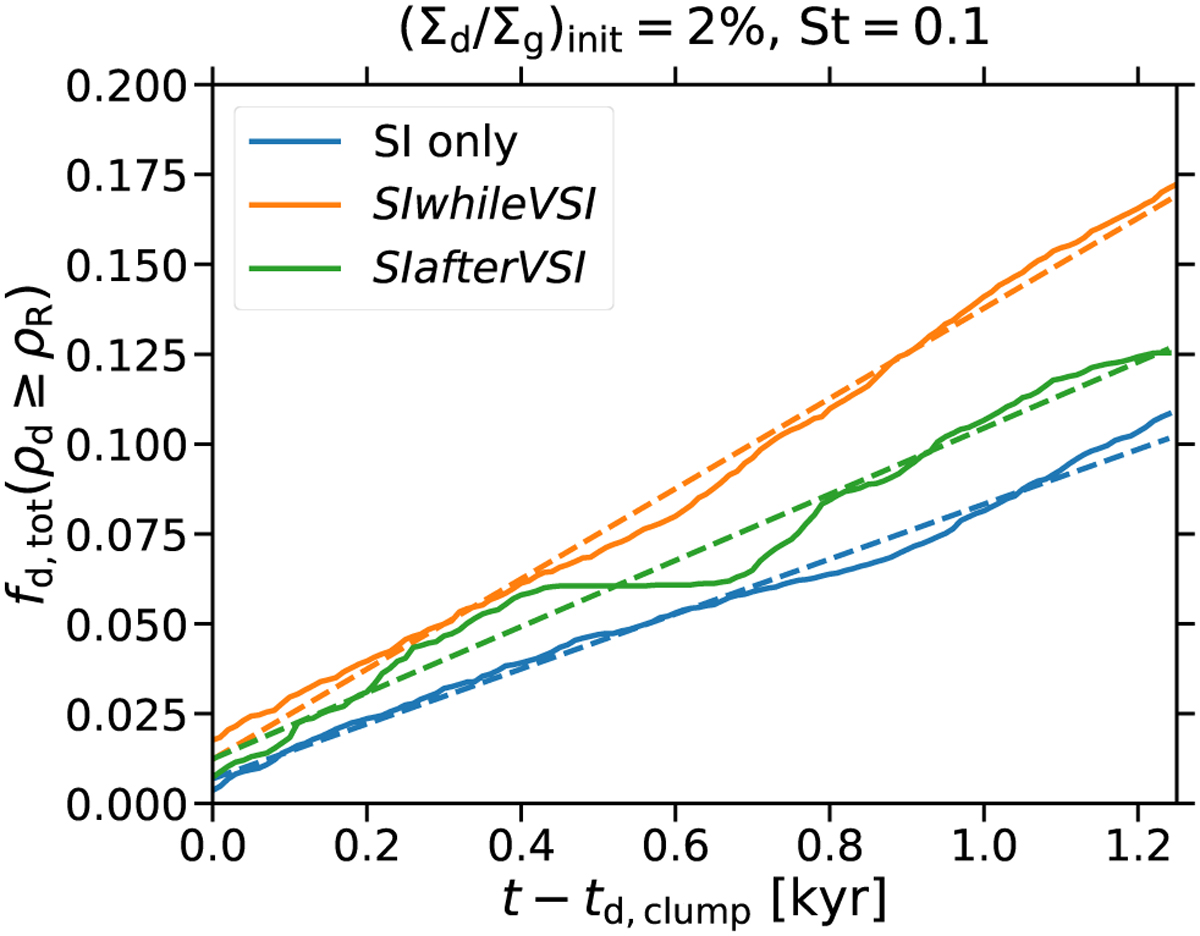
Cumulative fraction of the total dust mass fd,tot that has encountered a location where the dust density ρd exceeds the Roche density ρR as a function of the time t after the start of the strong-clumping phase td,clump. Simulations of the streaming instability in isolation (blue lines) as well as of the scenarios SIwhileVSI (orange lines) and SlafterVSI (green lines) with an initial dust-to-gas surface density ratio of 2% and a Stokes number of 0.1 are depicted. The cumulative fractions (solid lines) increase close to linearly (dashed lines) with time, with the increase being strongest in the scenario SIwhileVSI and weakest if only the streaming instability is taken into account.
Current usage metrics show cumulative count of Article Views (full-text article views including HTML views, PDF and ePub downloads, according to the available data) and Abstracts Views on Vision4Press platform.
Data correspond to usage on the plateform after 2015. The current usage metrics is available 48-96 hours after online publication and is updated daily on week days.
Initial download of the metrics may take a while.