Fig. 1
Download original image
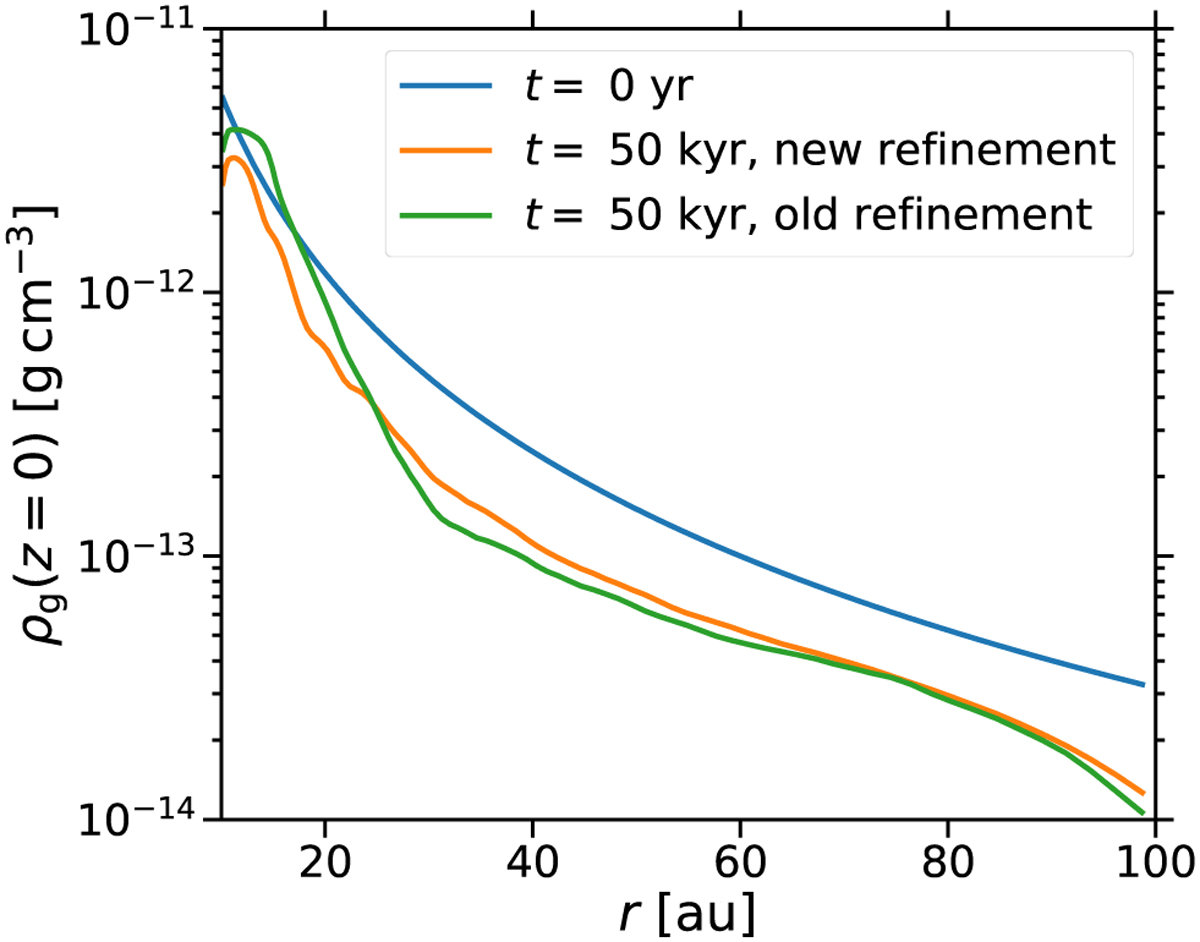
Gas density ρg in the mid-plane (at a height z = 0) as a function of the radius r. The blue line shows the initial density profile, while the orange and green line depict the profiles after 50 kyr in simulations including the static mesh refinement employed in SJB20 and in this study, respectively. Notably, a considerable bump at a radius of ~30 au is present in the former profile, but not in the latter one.
Current usage metrics show cumulative count of Article Views (full-text article views including HTML views, PDF and ePub downloads, according to the available data) and Abstracts Views on Vision4Press platform.
Data correspond to usage on the plateform after 2015. The current usage metrics is available 48-96 hours after online publication and is updated daily on week days.
Initial download of the metrics may take a while.