Open Access
Fig. 9.
Download original image
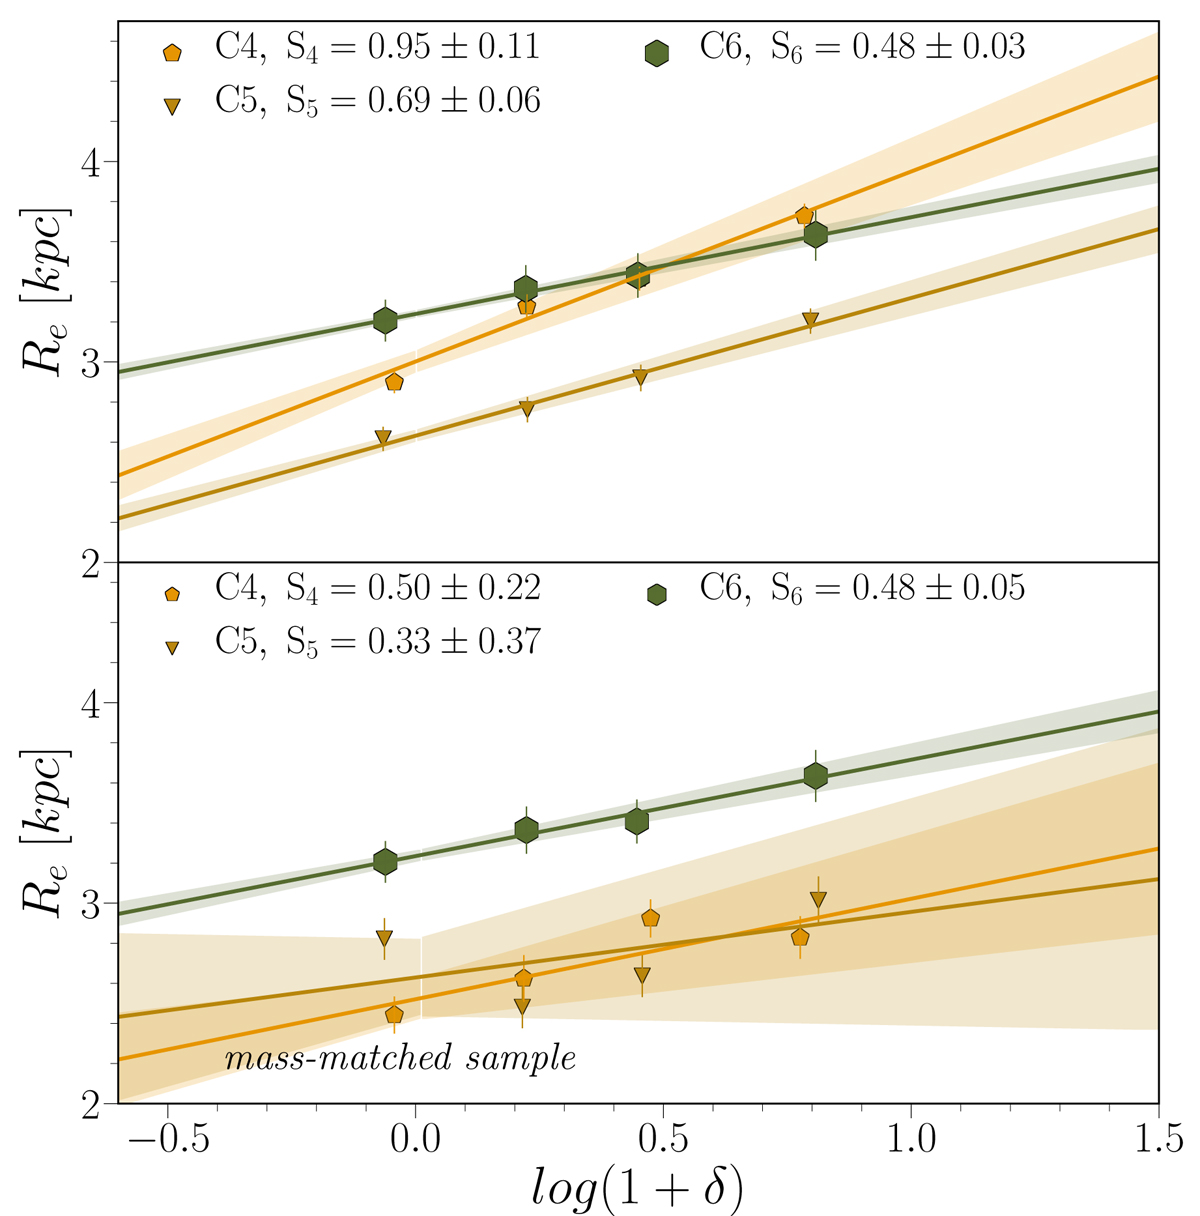
Upper panel: Re − δ relation for the three green galaxy sub-classes C4–6. The solid line corresponds to the weighted fit. The shaded stripes around lines display the 1σ uncertainty of the fit. Bottom panel: as for the top panel, but for the mass-matched sample. The Mstar distribution for each green sub-class is the same.
Current usage metrics show cumulative count of Article Views (full-text article views including HTML views, PDF and ePub downloads, according to the available data) and Abstracts Views on Vision4Press platform.
Data correspond to usage on the plateform after 2015. The current usage metrics is available 48-96 hours after online publication and is updated daily on week days.
Initial download of the metrics may take a while.