Fig. 5.
Download original image
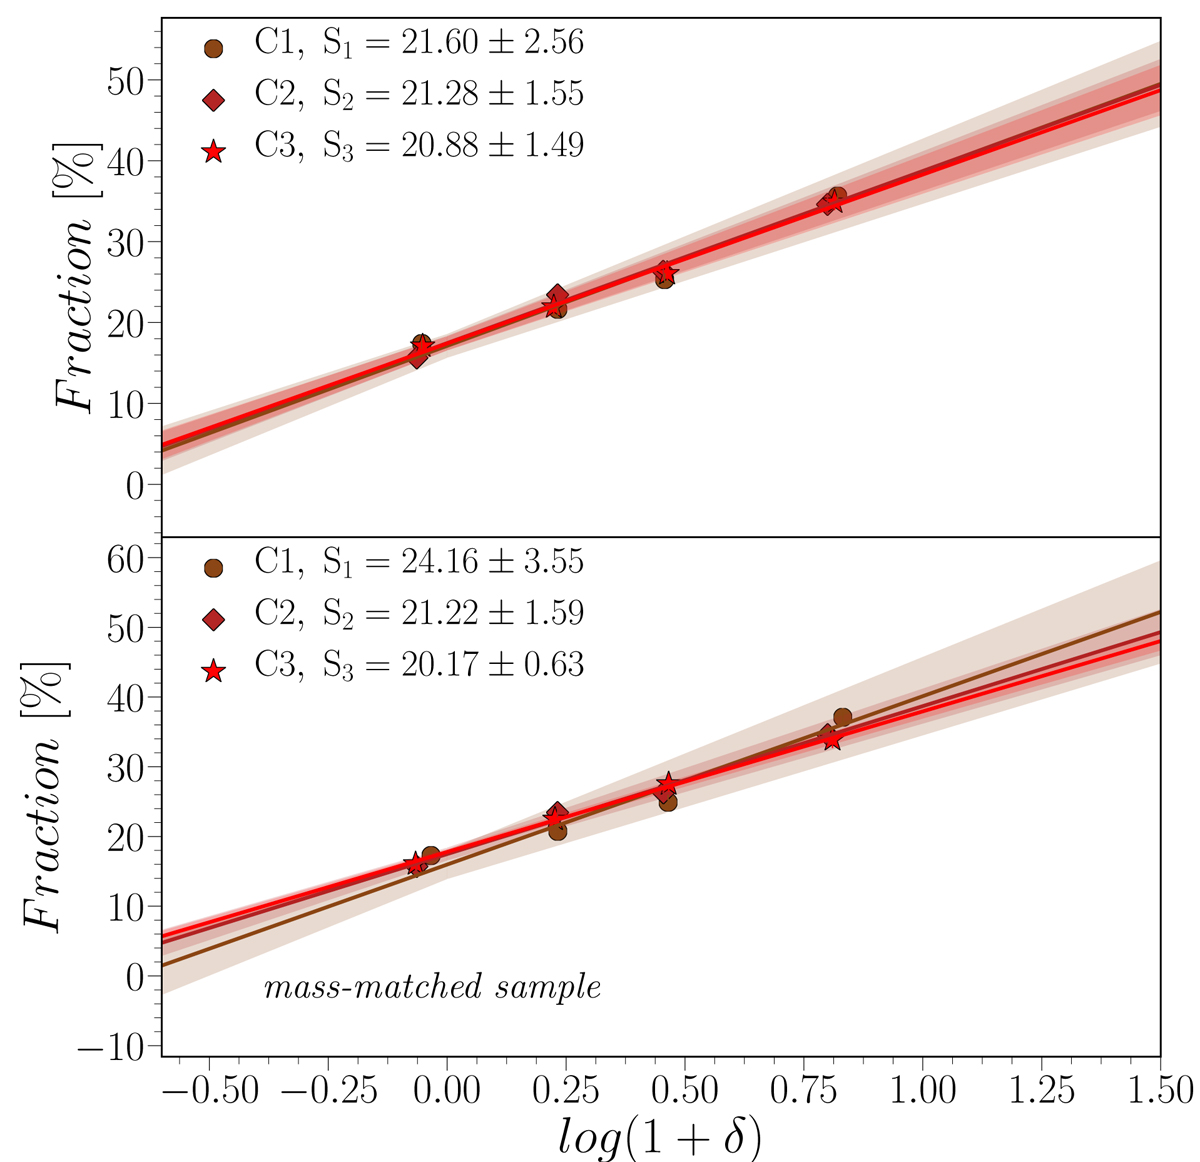
Upper panel: fractions of 3061, 1637, and 2478 red galaxies within C1, C2, and C3, respectively, as a function of the δ. The δ-bins correspond to the quartiles of the δ distribution for the whole sample, and the fractions are normalised to the total number of galaxies in the same sub-class, i.e. for each sub-class the fractions in δ bins sum up to 100%. The solid line corresponds to the weighted fit. The shaded stripes around lines display 1σ of the fit. The error bars correspond to the median absolute deviation on this and all the remaining plots. The slope of the fit is given in the legend. Bottom panel: as for the top panel, but for the mass-matched sample. The Mstar distribution for each red sub-class is the same.
Current usage metrics show cumulative count of Article Views (full-text article views including HTML views, PDF and ePub downloads, according to the available data) and Abstracts Views on Vision4Press platform.
Data correspond to usage on the plateform after 2015. The current usage metrics is available 48-96 hours after online publication and is updated daily on week days.
Initial download of the metrics may take a while.