Open Access
Fig. 4.
Download original image
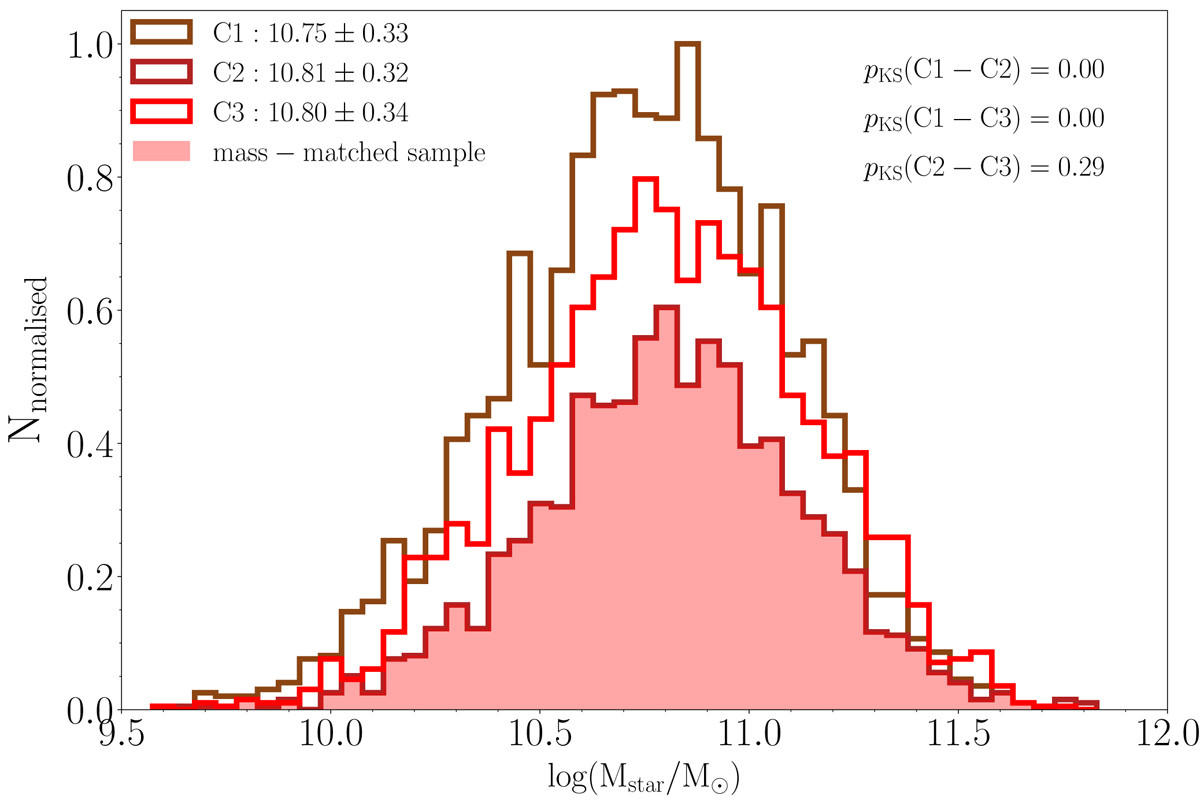
Mstar distributions of red sub-classes C1–3 normalised to the maximum value of the histograms. The mean and standard deviation are shown in the upper left. The KS probability is displayed in the upper right. The red filled histogram indicates the Mstar distribution for the mass-matched sample, which is the same for C1–3.
Current usage metrics show cumulative count of Article Views (full-text article views including HTML views, PDF and ePub downloads, according to the available data) and Abstracts Views on Vision4Press platform.
Data correspond to usage on the plateform after 2015. The current usage metrics is available 48-96 hours after online publication and is updated daily on week days.
Initial download of the metrics may take a while.