Fig. 1.
Download original image
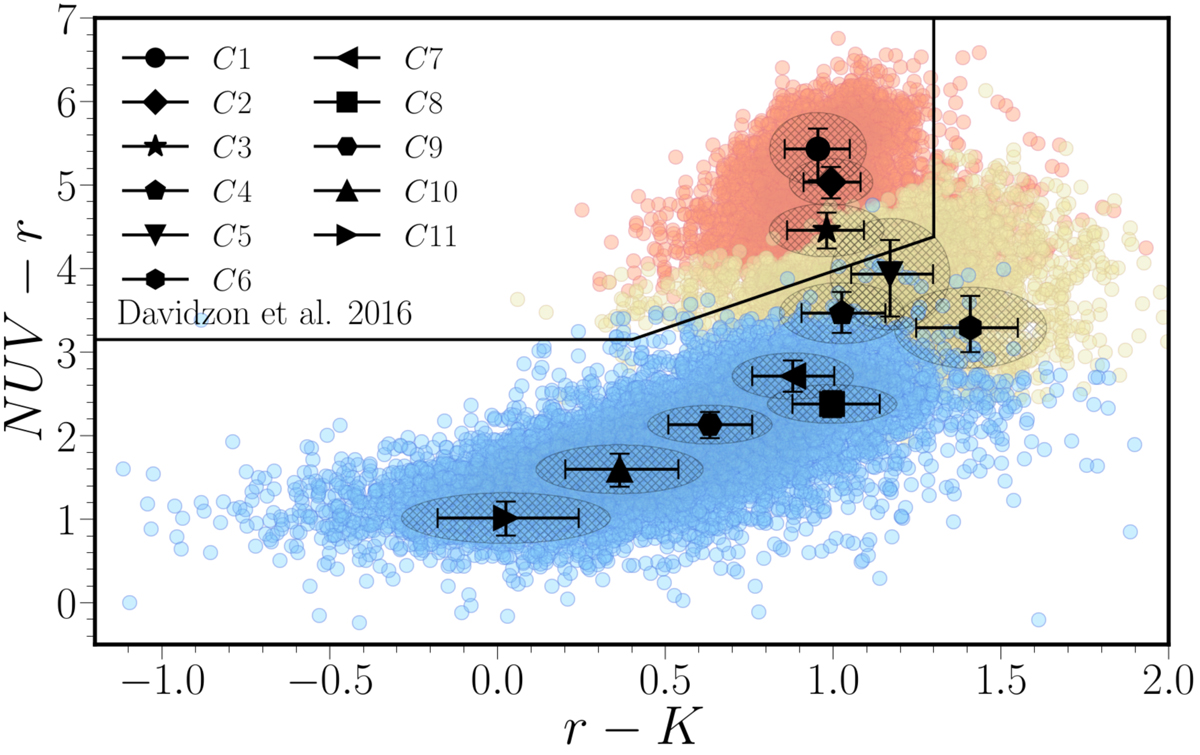
NUVrK diagram of the VIPERS galaxies classified into 11 sub-classes. The median colours of sub-classes are marked with points. The error bars correspond to the 25th and the 75th percentile range of the galaxy colour distribution. The size of ellipses correspond to the normalised median absolute deviation. Galaxies classified as red (C1–3) are separated from the blue galaxies (C7–11) by the solid black line as proposed by Davidzon et al. (2016). Green galaxies (C4–6) are located in between red and blue populations.
Current usage metrics show cumulative count of Article Views (full-text article views including HTML views, PDF and ePub downloads, according to the available data) and Abstracts Views on Vision4Press platform.
Data correspond to usage on the plateform after 2015. The current usage metrics is available 48-96 hours after online publication and is updated daily on week days.
Initial download of the metrics may take a while.