Fig. 2
Download original image
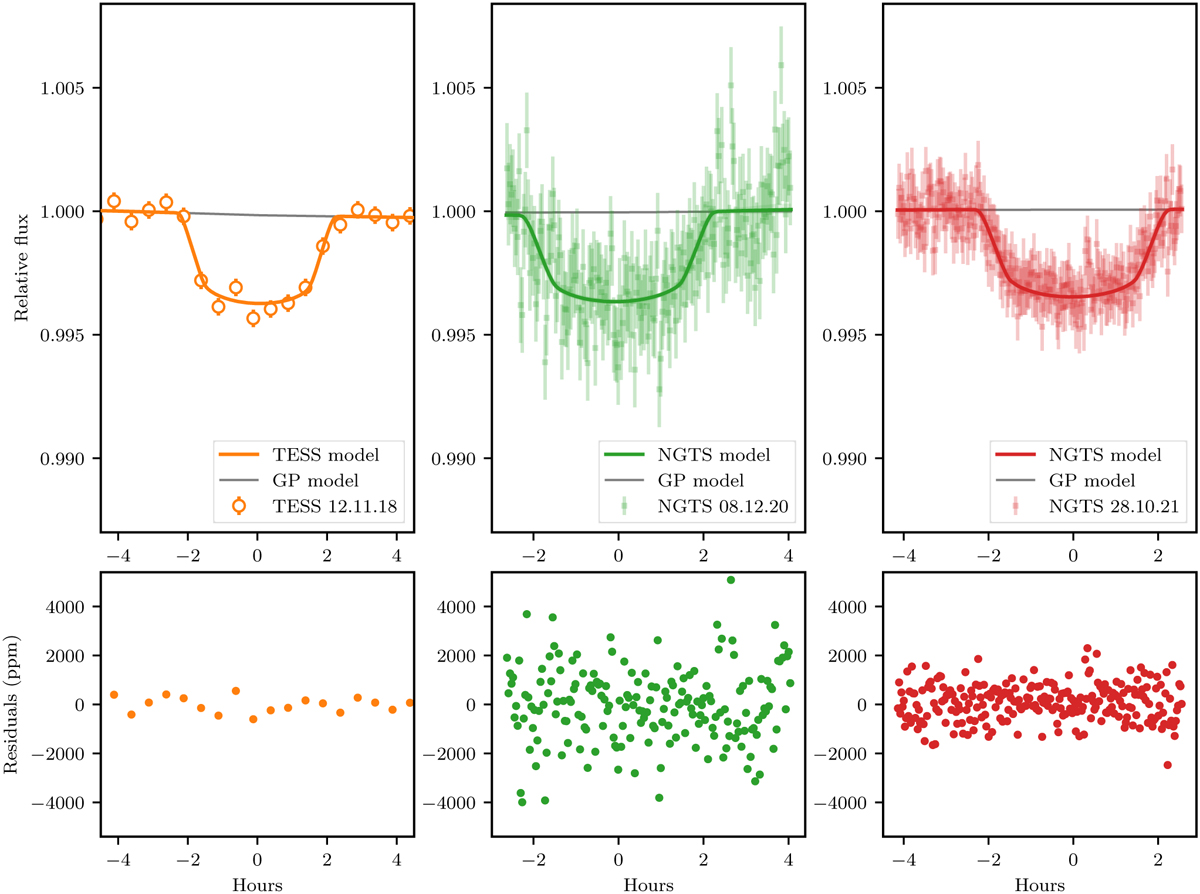
Top: photometric observations of NGTS-20 from TESS sector 4 at 30 min cadence (left panel) and NGTS binned at two-minute cadence {middle and right panels). In each panel, the data are shown are colored dots (orange, green, and red), the full model is represented with a line of the same color, and the Gaussian process model is shown as a gray line. Bottom: each panel shows the residuals in parts per million between the full model and the respective light curve.
Current usage metrics show cumulative count of Article Views (full-text article views including HTML views, PDF and ePub downloads, according to the available data) and Abstracts Views on Vision4Press platform.
Data correspond to usage on the plateform after 2015. The current usage metrics is available 48-96 hours after online publication and is updated daily on week days.
Initial download of the metrics may take a while.