Fig. 2
Download original image
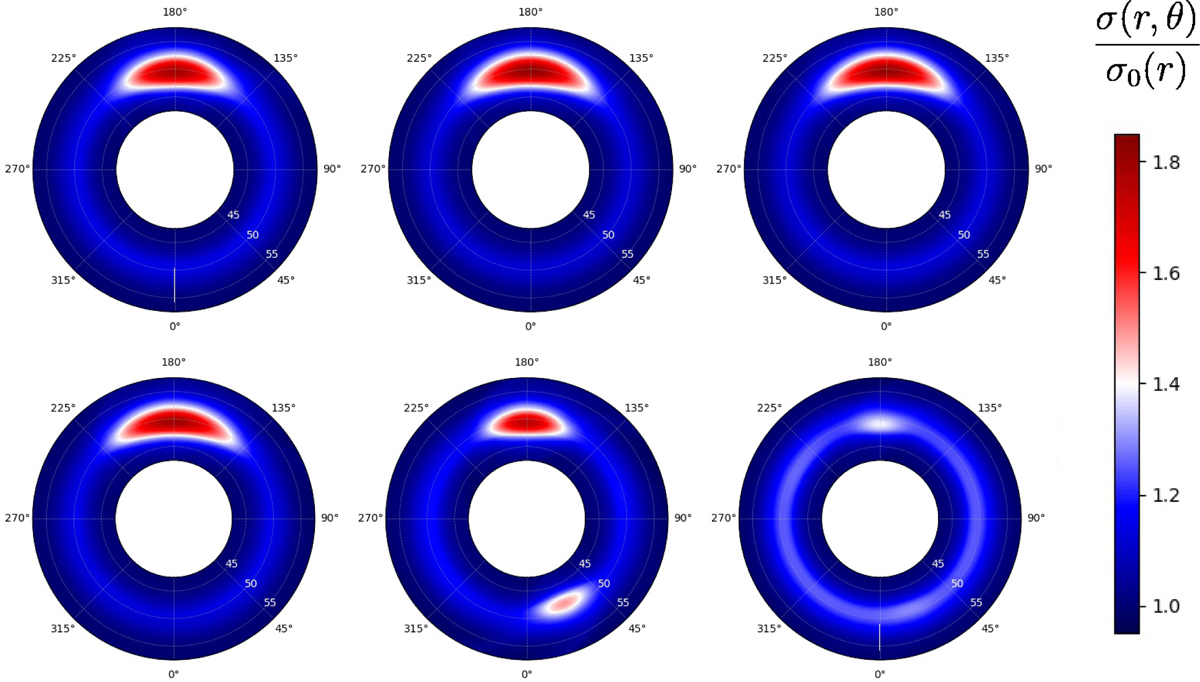
Comparison of the end-of-run surface density for increasing SG (t = 300 t0). Top row and from left to right: q0 = ∞, 4, 2; bottom row and from left to right: q0 = 1, 0.5, 0.25. The initial vortex parameters are: δ = 1.5 and χ = 14. The simulation window was centred in r ∈ [42.5, 57.5] AU in order to better appreciate the inner vortex structure.
Current usage metrics show cumulative count of Article Views (full-text article views including HTML views, PDF and ePub downloads, according to the available data) and Abstracts Views on Vision4Press platform.
Data correspond to usage on the plateform after 2015. The current usage metrics is available 48-96 hours after online publication and is updated daily on week days.
Initial download of the metrics may take a while.