Fig. 3
Download original image
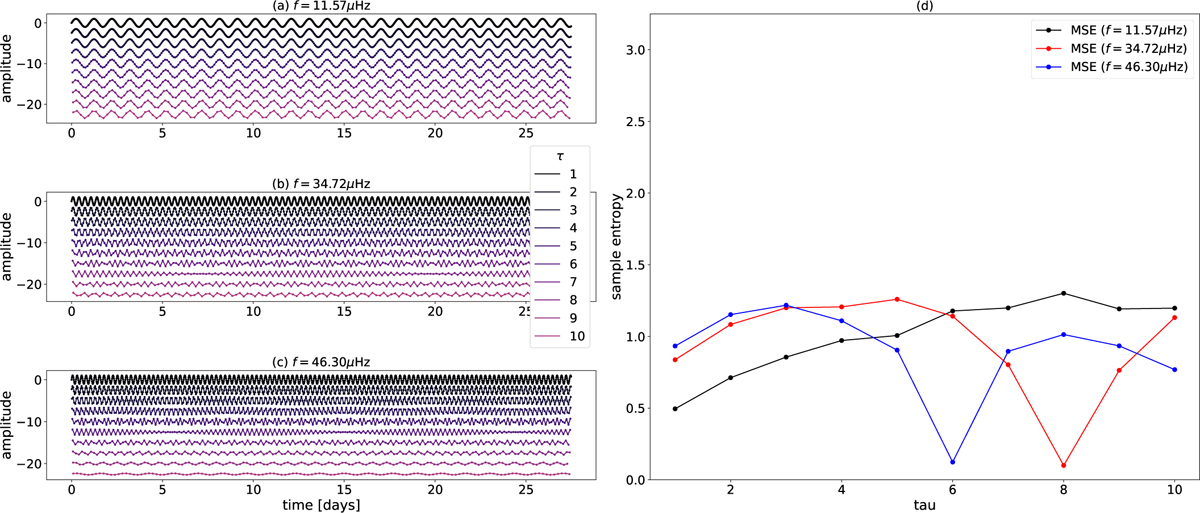
Coarse-grained time series for three different simulated sine waves (left panels; same interpretation as top plot in Fig. 2). The sine waves have an initial frequency of (a) ƒ = 11.57 μHz, (b) ƒ = 34.72 μHz and (c) ƒ = 46.30 μHz. They are interpreted in the same way as the top panel in Fig. 2. The right column (d) shows the MSE curve for each of these different sine waves.
Current usage metrics show cumulative count of Article Views (full-text article views including HTML views, PDF and ePub downloads, according to the available data) and Abstracts Views on Vision4Press platform.
Data correspond to usage on the plateform after 2015. The current usage metrics is available 48-96 hours after online publication and is updated daily on week days.
Initial download of the metrics may take a while.