Fig. 2
Download original image
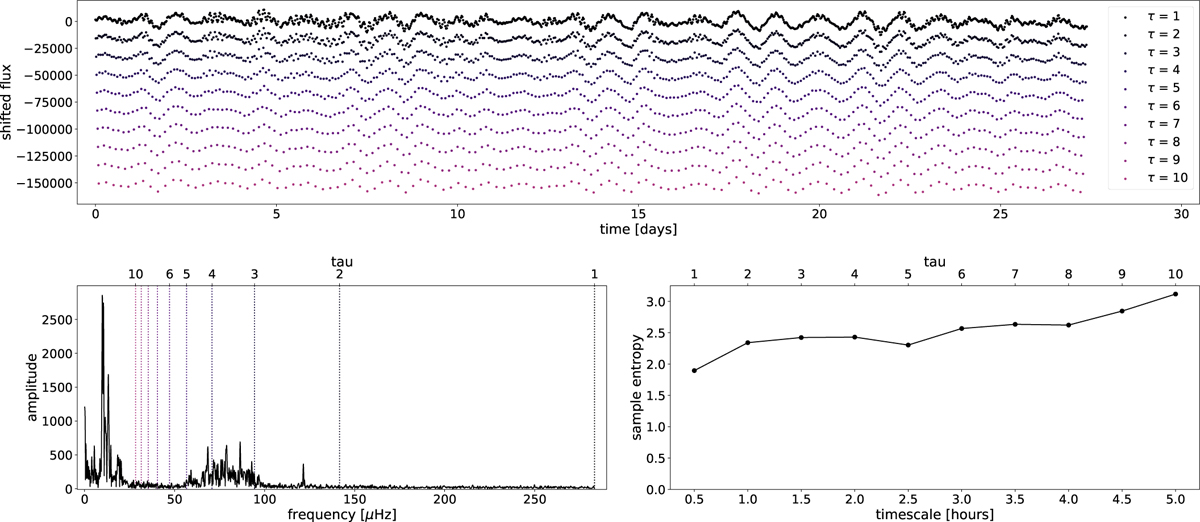
Effect of coarse-graining the γDor star KIC005038228. Top panel: coarse-grained light curves for an increasing τ, which indicates the scaling factor. We use an offset of 20 000 per step (τ) for visualization purposes. Bottom left panel: amplitude spectrum of the original light curve in black. The dashed lines are the Nyquist frequencies at each scaling factor, and illustrate the low-pass filter effect that occurs due to coarse-graining. It is clear from this that the low-pass filter removes the higher frequencies at each step. Bottom right panel: corresponding multiscale entropy curve. Each point on the curve represents the sample entropy calculated for a particular scaling factor.
Current usage metrics show cumulative count of Article Views (full-text article views including HTML views, PDF and ePub downloads, according to the available data) and Abstracts Views on Vision4Press platform.
Data correspond to usage on the plateform after 2015. The current usage metrics is available 48-96 hours after online publication and is updated daily on week days.
Initial download of the metrics may take a while.