Fig. 1
Download original image
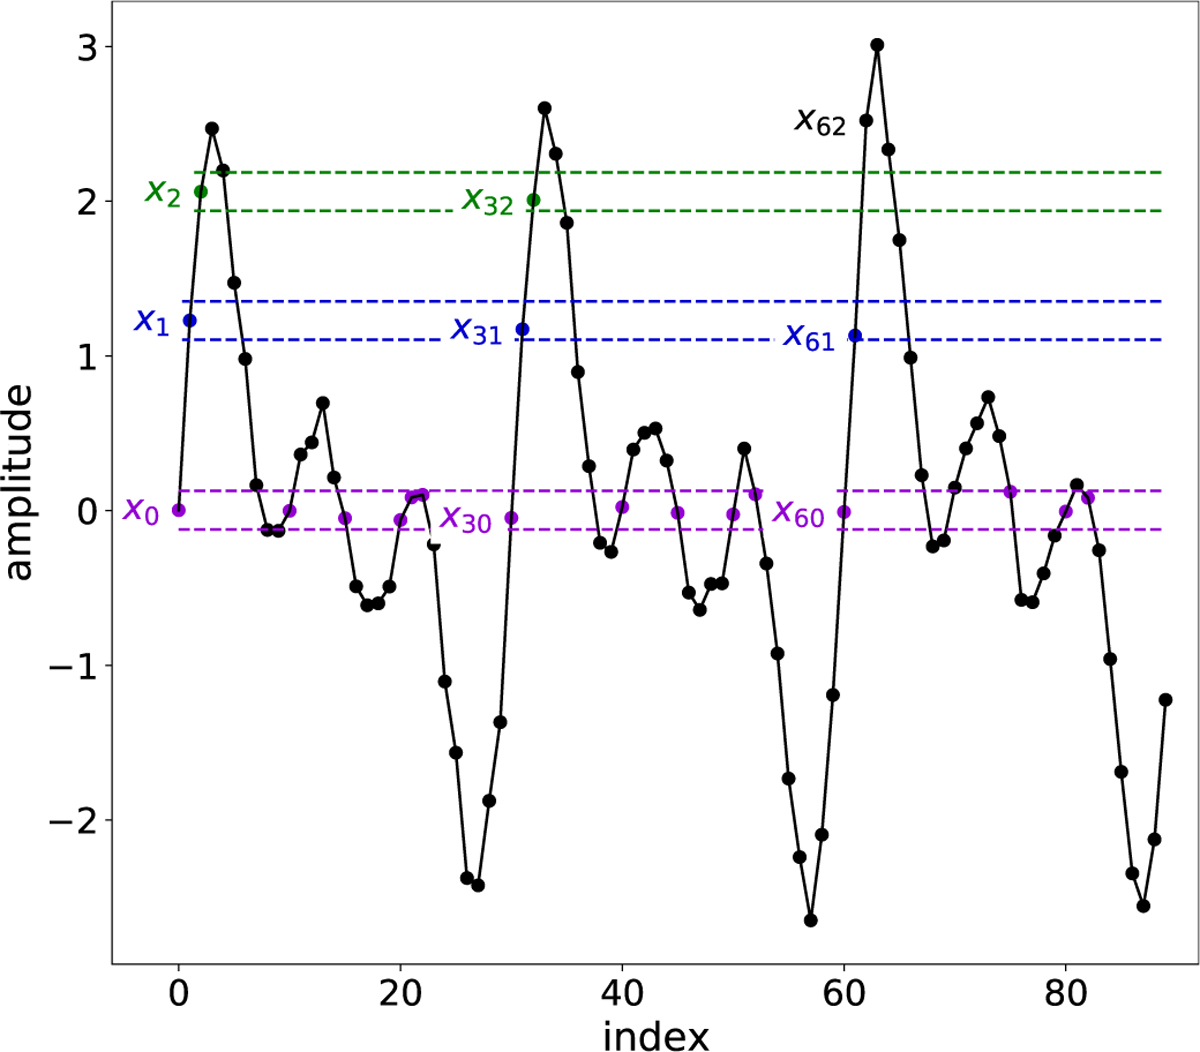
Graphical illustration of the sequence identification procedure that is used to calculate the sample entropy for a simulated light curve. We set r = 0.1 × σligi,t curve and m = 2 in this example. The dashed horizontal lines represent x0 ± r, x\ ± r and x2 ± r. The points that fall within this boundary, namely d[xi,xj] < r, are color-coded in, respectively, purple, blue and green. The first unique sequence or template vector of two components (m = 2) is u1,m = (x0,x1). Two other sequences match this template vector in the light curve, namely the sequences (x30,x31) and (x60,x61). Extending u1 to three components (m + 1) then gives (x0,x1,x2), occurring only once more in the light curve at (x30, x31, x32), as x62 does not fall within the tolerance margin r for the extension of (x60, x61 ) to m + 1. There are thus three matches of length ra for the template vector u1 and two matches for its extension to length m + 1. This procedure is then repeated for all other two component template vectors (ui,m+1 = (x1,x2),…,(xN-2, xN-1)) and their three component extensions (ui,m+1 = (x1,x2,xз),…, (xn-2, xn-1, xn))
Current usage metrics show cumulative count of Article Views (full-text article views including HTML views, PDF and ePub downloads, according to the available data) and Abstracts Views on Vision4Press platform.
Data correspond to usage on the plateform after 2015. The current usage metrics is available 48-96 hours after online publication and is updated daily on week days.
Initial download of the metrics may take a while.