Fig. 9.
Download original image
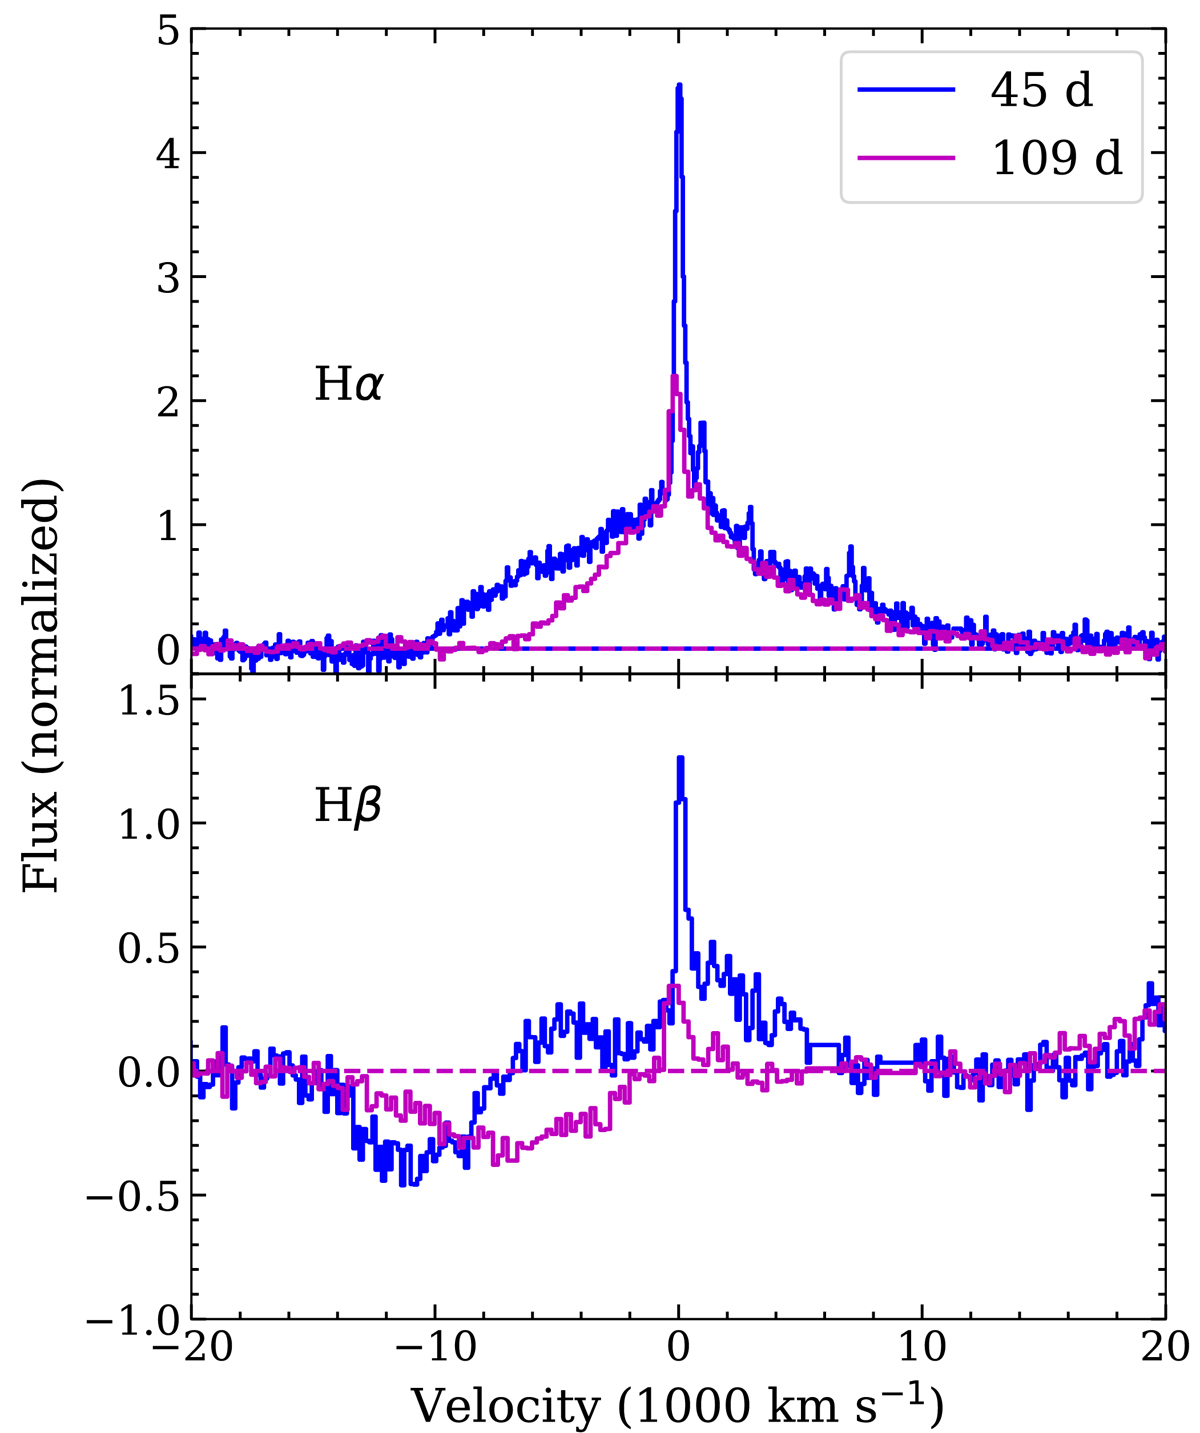
Comparison of the Hα (upper panel) and Hβ (lower) line profiles at 45 (blue) and 109 (red) days. The flux of both lines and at both epochs have been normalized to the Hα flux density at −2000 km s−1. We note the nearly identical red wing of Hα, while the blue wing above ∼4000 km s−1 shows a strong decrease in flux. The Hβ line shows a similar evolution of the blue wing, with an increasing absorption component of the P-Cygni profile. The [O III] λλ4959, 5007 lines from the background in the red wing of Hβ have been masked out.
Current usage metrics show cumulative count of Article Views (full-text article views including HTML views, PDF and ePub downloads, according to the available data) and Abstracts Views on Vision4Press platform.
Data correspond to usage on the plateform after 2015. The current usage metrics is available 48-96 hours after online publication and is updated daily on week days.
Initial download of the metrics may take a while.