Open Access
Fig. 8.
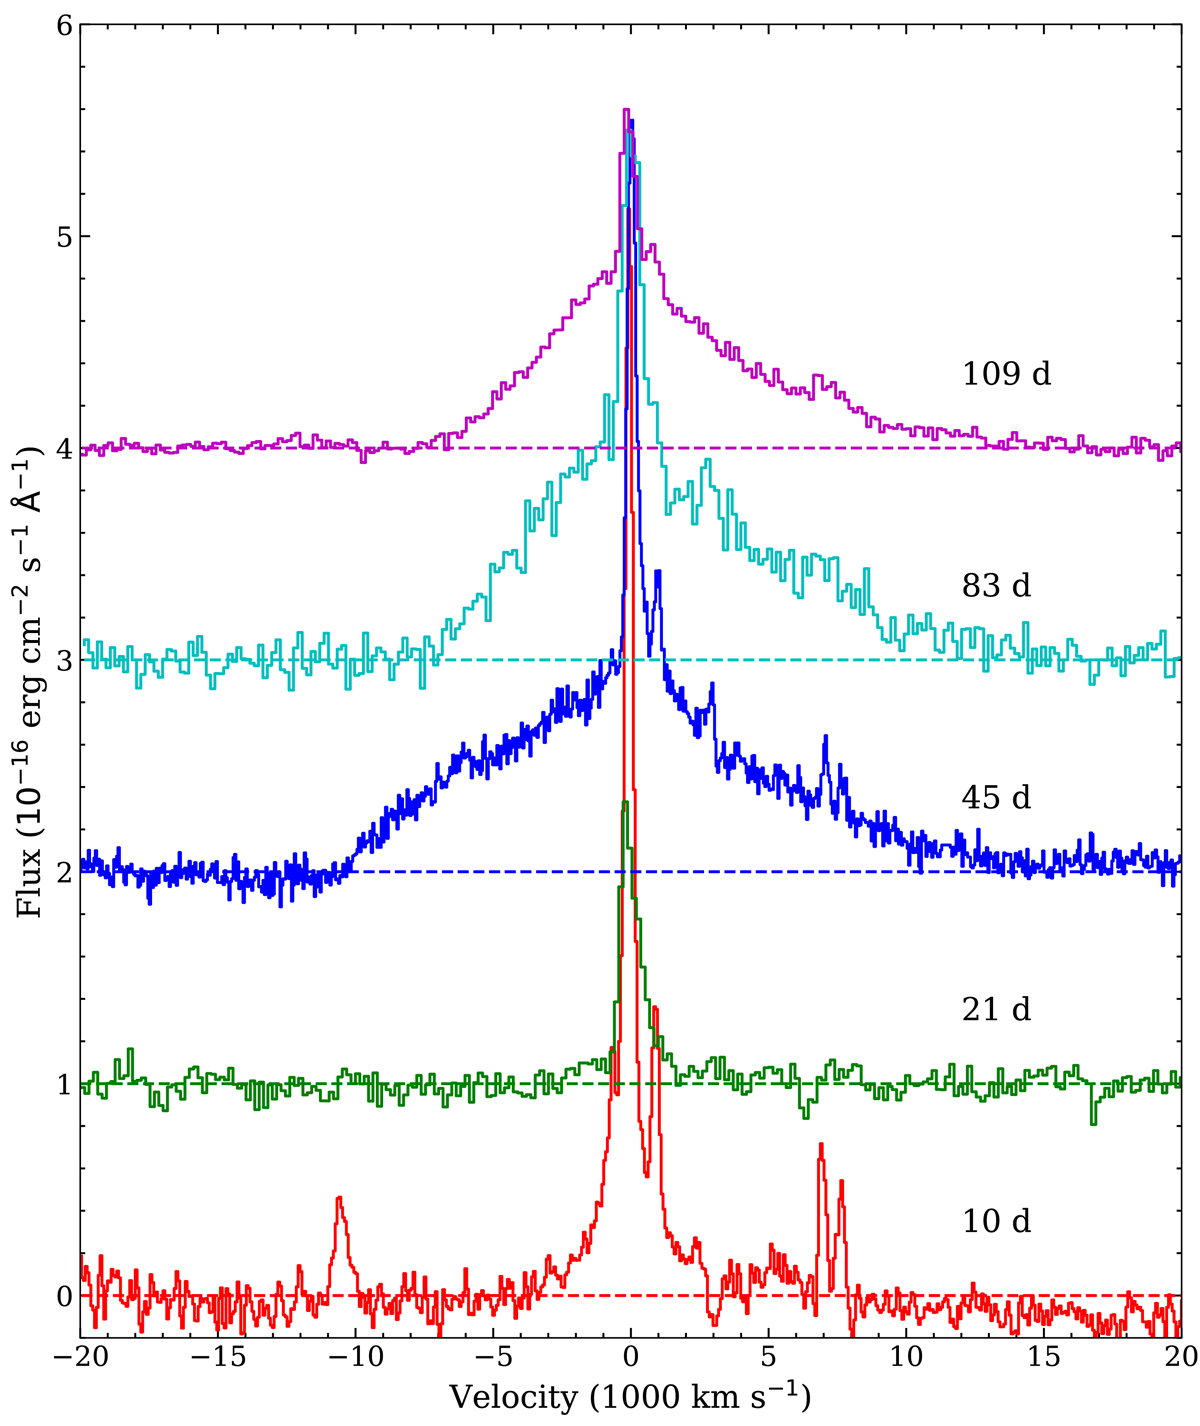
Download original image
Evolution of the Hα line. The continuum level is subtracted and each spectrum is shifted upwards for clarity. Note the dramatic change in line profile between days 21 and 45, where the narrow line is replaced by a broad line profile, reflecting the shock velocity. Each spectrum has been shifted by 10−16 erg cm−2 s−1.
Current usage metrics show cumulative count of Article Views (full-text article views including HTML views, PDF and ePub downloads, according to the available data) and Abstracts Views on Vision4Press platform.
Data correspond to usage on the plateform after 2015. The current usage metrics is available 48-96 hours after online publication and is updated daily on week days.
Initial download of the metrics may take a while.