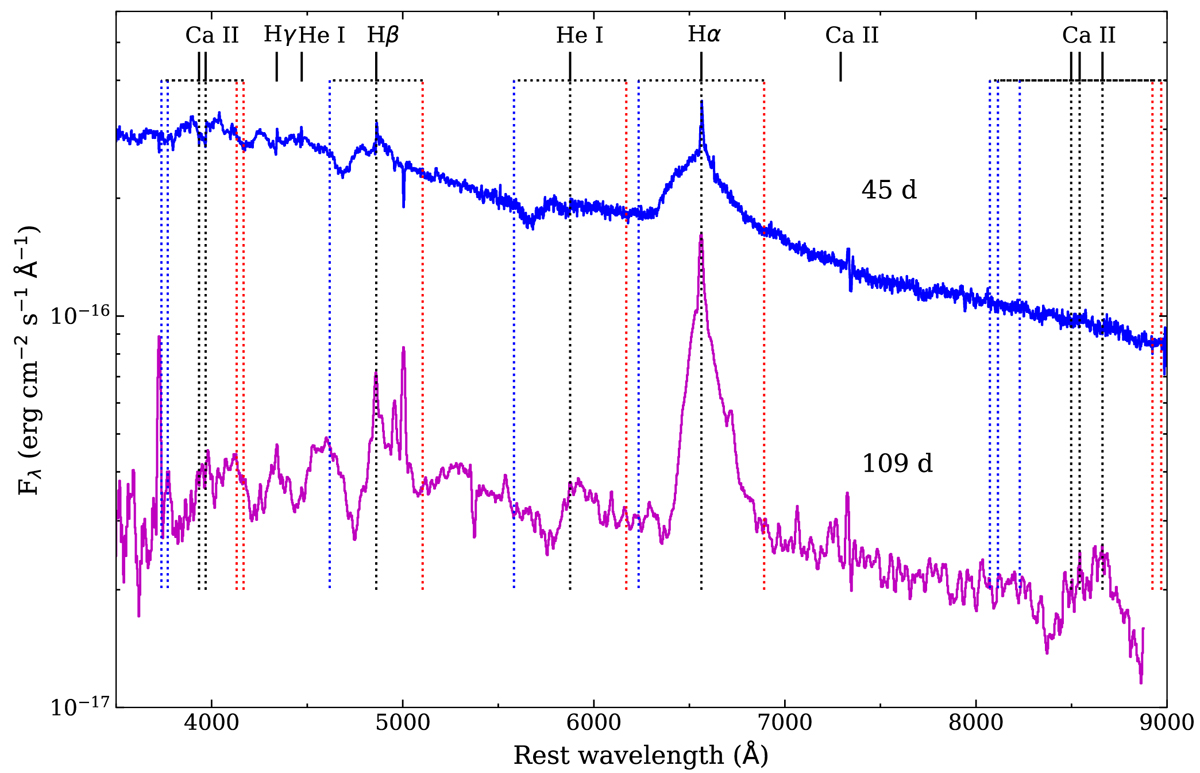
Fig. 7.
Download original image
Comparison of the spectra at 45 (blue) and 109 (magenta) days. We note the increase in the relative Hα flux and the much deeper absorption features in the day 109 spectrum. The dotted blue and red vertical lines show the wavelengths corresponding to ±15 000 km s−1. The spectra have been smoothed by a third order Savitzky–Golay filter, with windows of 5 and 11 pixels, respectively.
Current usage metrics show cumulative count of Article Views (full-text article views including HTML views, PDF and ePub downloads, according to the available data) and Abstracts Views on Vision4Press platform.
Data correspond to usage on the plateform after 2015. The current usage metrics is available 48-96 hours after online publication and is updated daily on week days.
Initial download of the metrics may take a while.