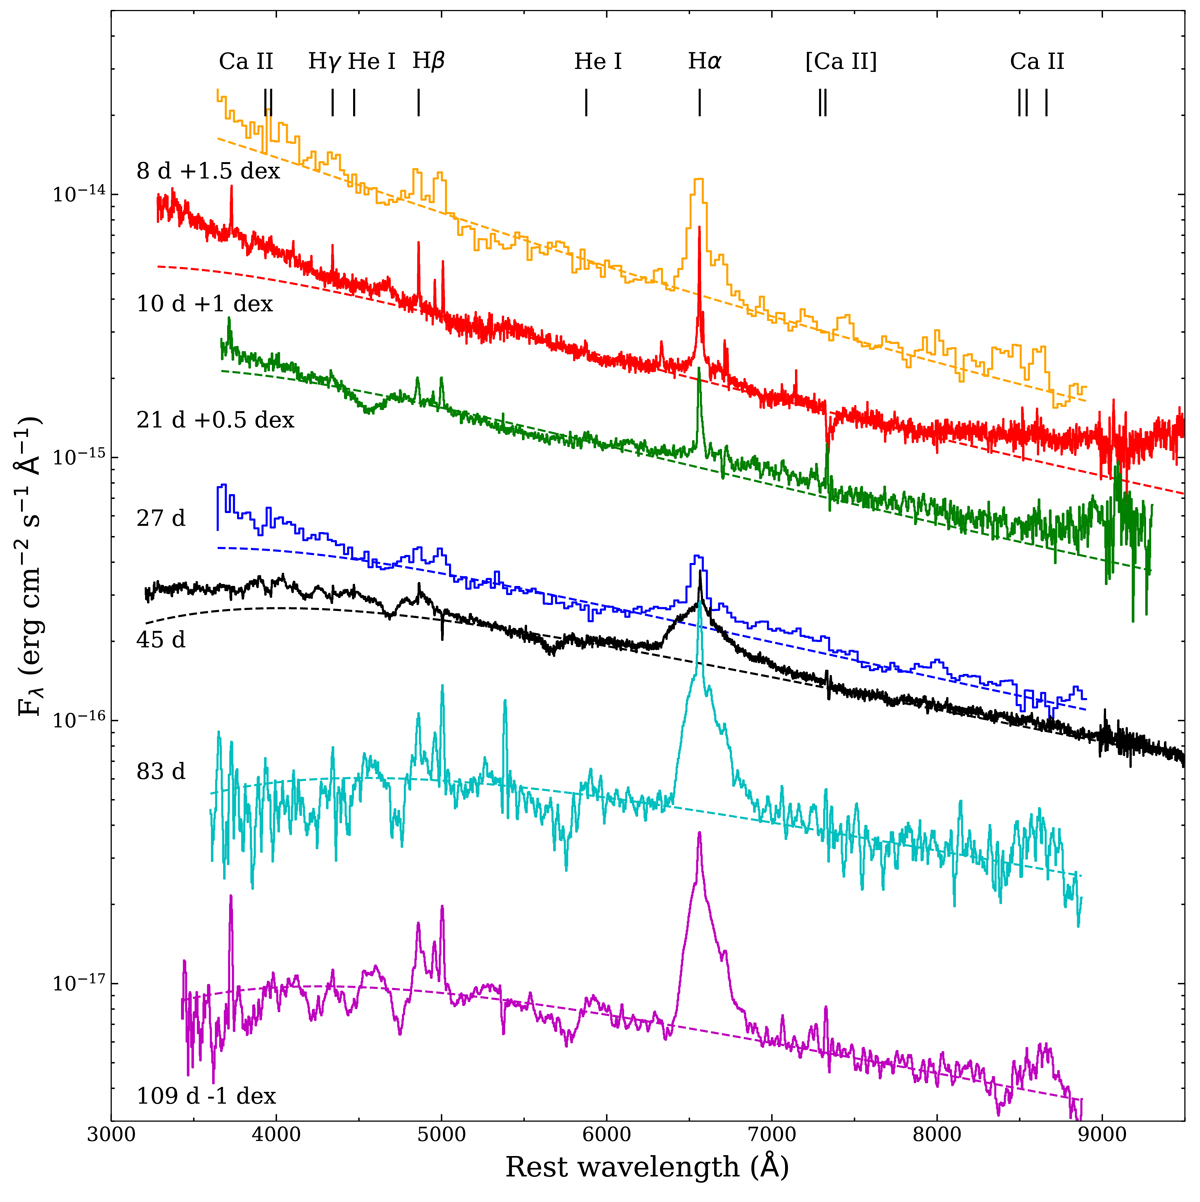
Fig. 6.
Download original image
Spectral sequence illustrating the spectral evolution of SN 2019zrk. The early P200 spectrum at 8 days (red) revealed a Type IIn SN with a blue continuum and superimposed narrow emission lines. A month later, the deep Keck spectrum (black) instead shows a broad and asymmetric line profile of Hα, which typically reflects strong CSM interaction. Finally, the day 83 and 109 NOT spectra display increasingly strong P-Cygni absorption features. The dashed lines for each spectrum show blackbody fits to the continuum (see text). For clarity some of the spectra have been shifted by the logarithmic factor provided together with the phase in the figure. All spectra are corrected for the Milky Way extinction.
Current usage metrics show cumulative count of Article Views (full-text article views including HTML views, PDF and ePub downloads, according to the available data) and Abstracts Views on Vision4Press platform.
Data correspond to usage on the plateform after 2015. The current usage metrics is available 48-96 hours after online publication and is updated daily on week days.
Initial download of the metrics may take a while.