Fig. 4.
Download original image
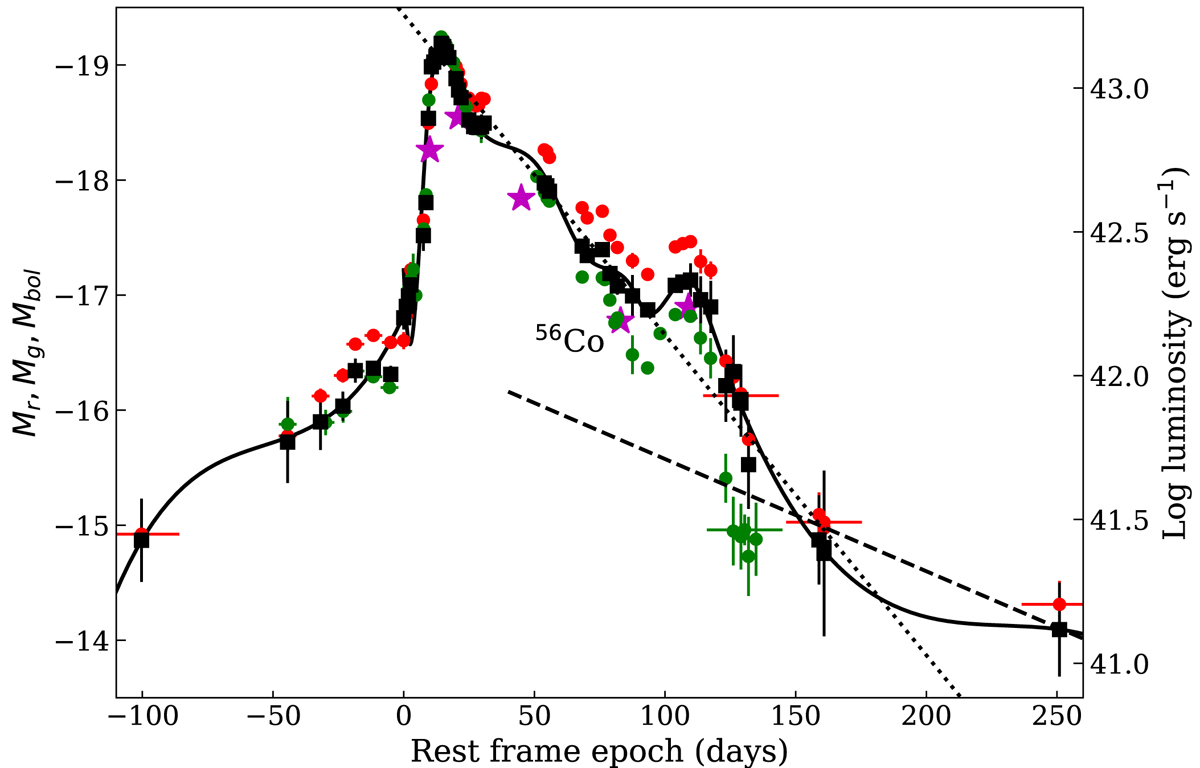
Bolometric light curve (black squares and solid line) of SN 2019zrk, together with the r- (red) and g-band (green) photometry. The magenta stars show the pseudo-bolometric magnitudes from our spectra, while the dashed line shows the expected late light curve from 56Co decay, corresponding to a 56Ni mass of 0.09 M⊙ and full trapping in the nebular stage. The dotted, black line shows an exponential fit to the luminosity (see text).
Current usage metrics show cumulative count of Article Views (full-text article views including HTML views, PDF and ePub downloads, according to the available data) and Abstracts Views on Vision4Press platform.
Data correspond to usage on the plateform after 2015. The current usage metrics is available 48-96 hours after online publication and is updated daily on week days.
Initial download of the metrics may take a while.