Fig. 2.
Download original image
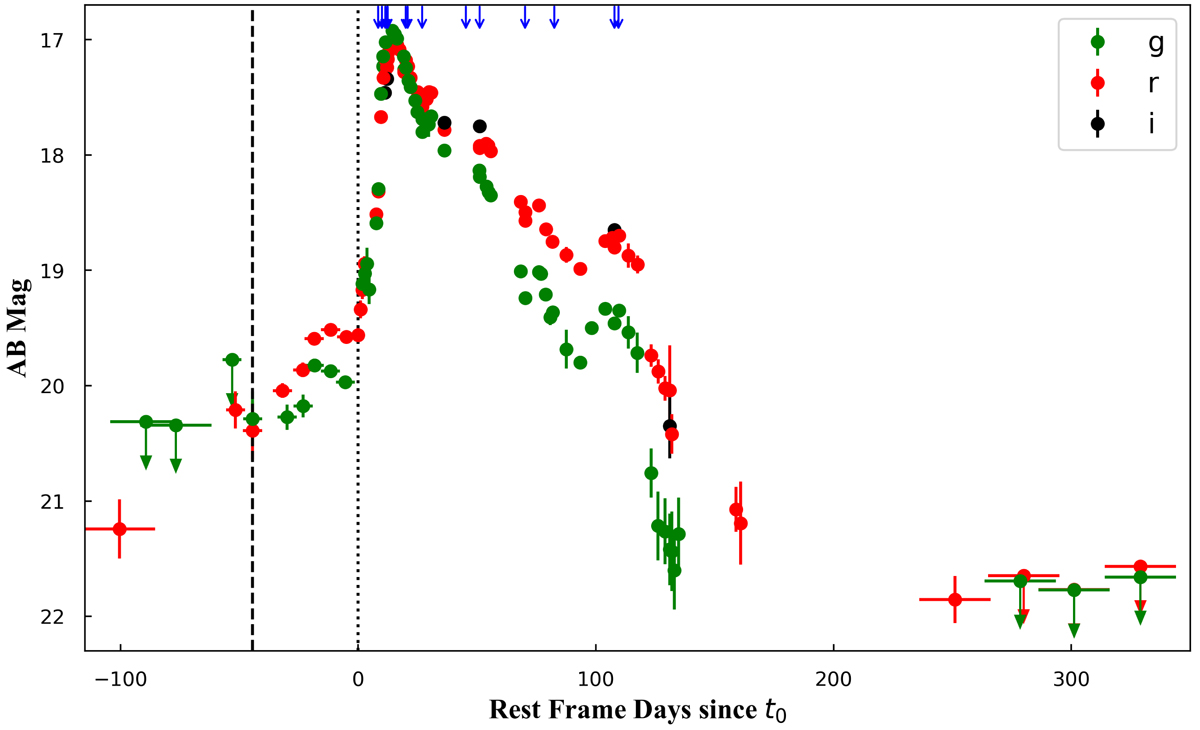
Light curves of SN 2019zrk in the g (green symbols), r (red) and i (black) bands. These are observed (AB) magnitudes plotted versus rest frame time in days since the rise of the main peak on ![]() (Sect. 3.1), marked as the vertical dotted line. The vertical dashed line marks the epoch of the first 5σ detection of the precursor. The horizontal error bars indicate the 7 and 30 day binning periods used for the precursor and late observations. Magnitudes are corrected for Milky Way extinction. The blue arrows on top show epochs of spectroscopy.
(Sect. 3.1), marked as the vertical dotted line. The vertical dashed line marks the epoch of the first 5σ detection of the precursor. The horizontal error bars indicate the 7 and 30 day binning periods used for the precursor and late observations. Magnitudes are corrected for Milky Way extinction. The blue arrows on top show epochs of spectroscopy.
Current usage metrics show cumulative count of Article Views (full-text article views including HTML views, PDF and ePub downloads, according to the available data) and Abstracts Views on Vision4Press platform.
Data correspond to usage on the plateform after 2015. The current usage metrics is available 48-96 hours after online publication and is updated daily on week days.
Initial download of the metrics may take a while.