Fig. 5
Download original image
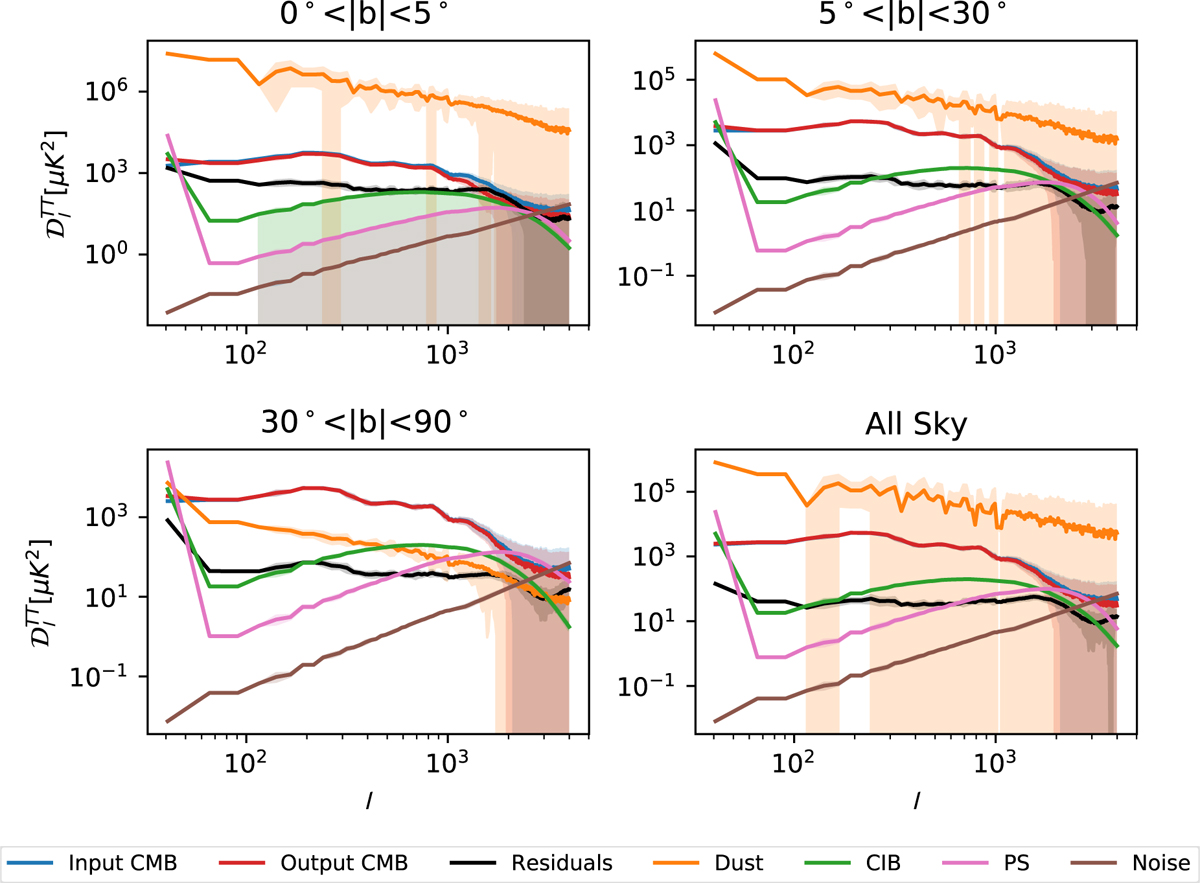
Mean power spectrum of the residuals (black) and its uncertainty (grey area) for 0° < |b| < 5° (top left panel), 5° < |b| < 30° (top right panel), 30° < |b| < 90° (bottom left panel) and for the whole sky (bottom right panel) against the input and output CMB (blue and red lines, respectively) and their uncertainties (blue and red areas, respectively). In all cases, the uncertainties are the standard deviation of each bin. The contribution of each foreground in the simulations through their power spectra is also plotted. The thermal dust is represented by the orange line, the PS and CIB by the pink and green lines, respectively, and the instrumental noise is shown by the brown line.
Current usage metrics show cumulative count of Article Views (full-text article views including HTML views, PDF and ePub downloads, according to the available data) and Abstracts Views on Vision4Press platform.
Data correspond to usage on the plateform after 2015. The current usage metrics is available 48-96 hours after online publication and is updated daily on week days.
Initial download of the metrics may take a while.