Open Access
Fig. 4
Download original image
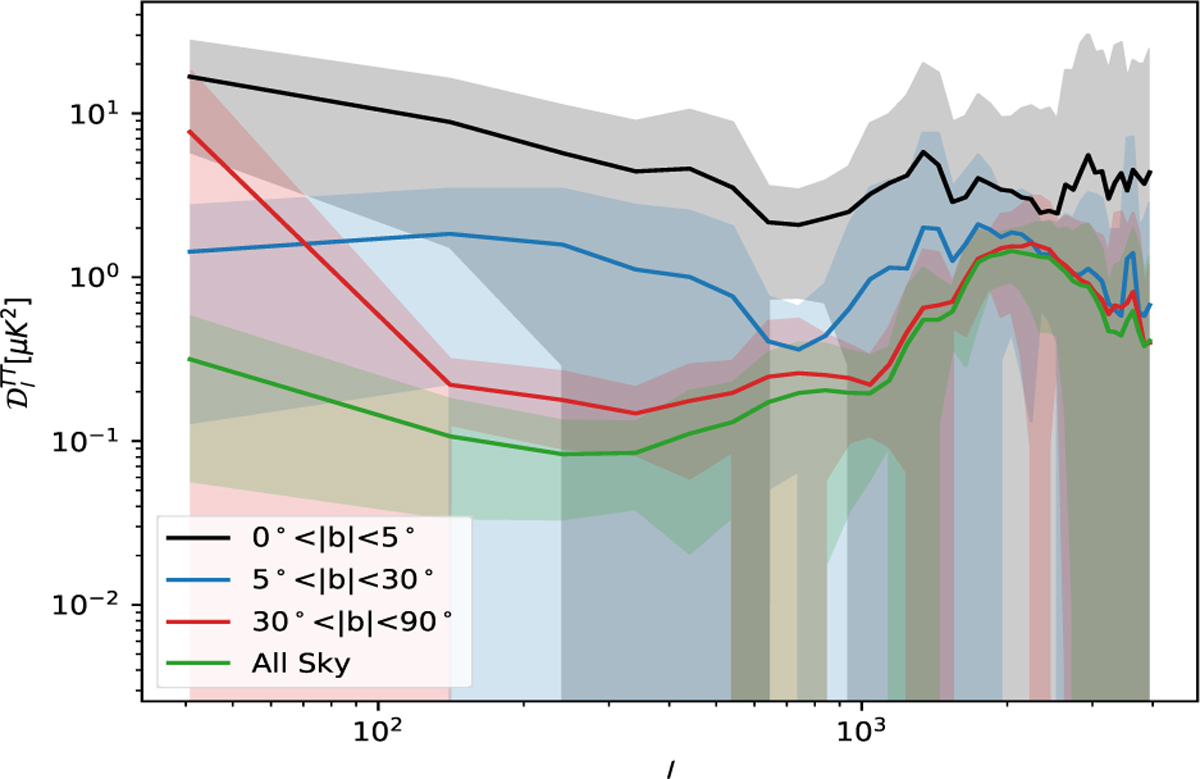
Power spectrum of the mean residual patches for the whole sky (green continuous line) and for 0o < |b| < 5° (continuous black line), 5° < |b| < 30° (continuous blue line), 30° < |b| < 90° (continuous red line). The corresponding coloured areas are the standard deviation of each bin.
Current usage metrics show cumulative count of Article Views (full-text article views including HTML views, PDF and ePub downloads, according to the available data) and Abstracts Views on Vision4Press platform.
Data correspond to usage on the plateform after 2015. The current usage metrics is available 48-96 hours after online publication and is updated daily on week days.
Initial download of the metrics may take a while.