Fig. 1
Download original image
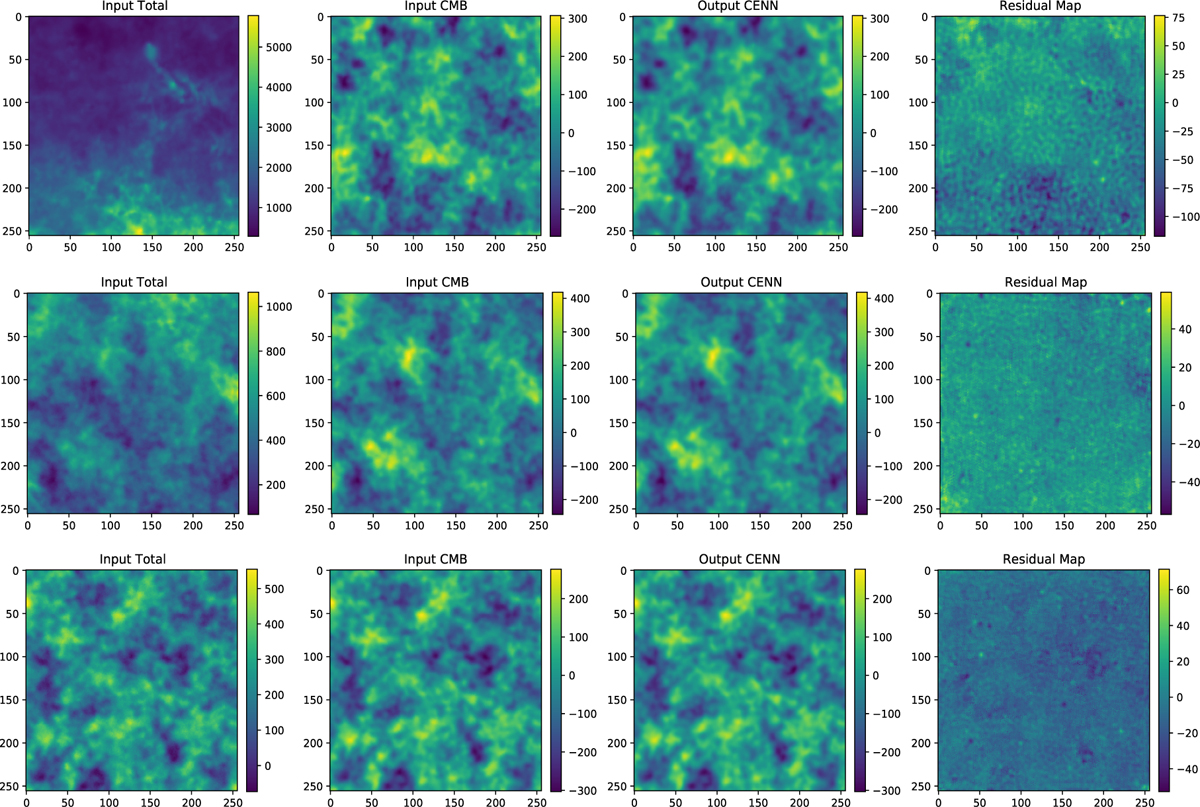
Patches at 0° < |b| < 5° (top row), 5° < |b| < 30° (middle row), and 30° < |b| < 90° (bottom row) latitude intervals. They represent the maps with all the emissions, the CMB label, the neural network output, and the residual map computed as the difference between the second and the third column patches from left to right. The frequency is 217 GHz, and their temperature (in µKCMB) is shown in the right vertical bars. The x and y labels are the pixel coordinates for each 256 × 256 patch.
Current usage metrics show cumulative count of Article Views (full-text article views including HTML views, PDF and ePub downloads, according to the available data) and Abstracts Views on Vision4Press platform.
Data correspond to usage on the plateform after 2015. The current usage metrics is available 48-96 hours after online publication and is updated daily on week days.
Initial download of the metrics may take a while.