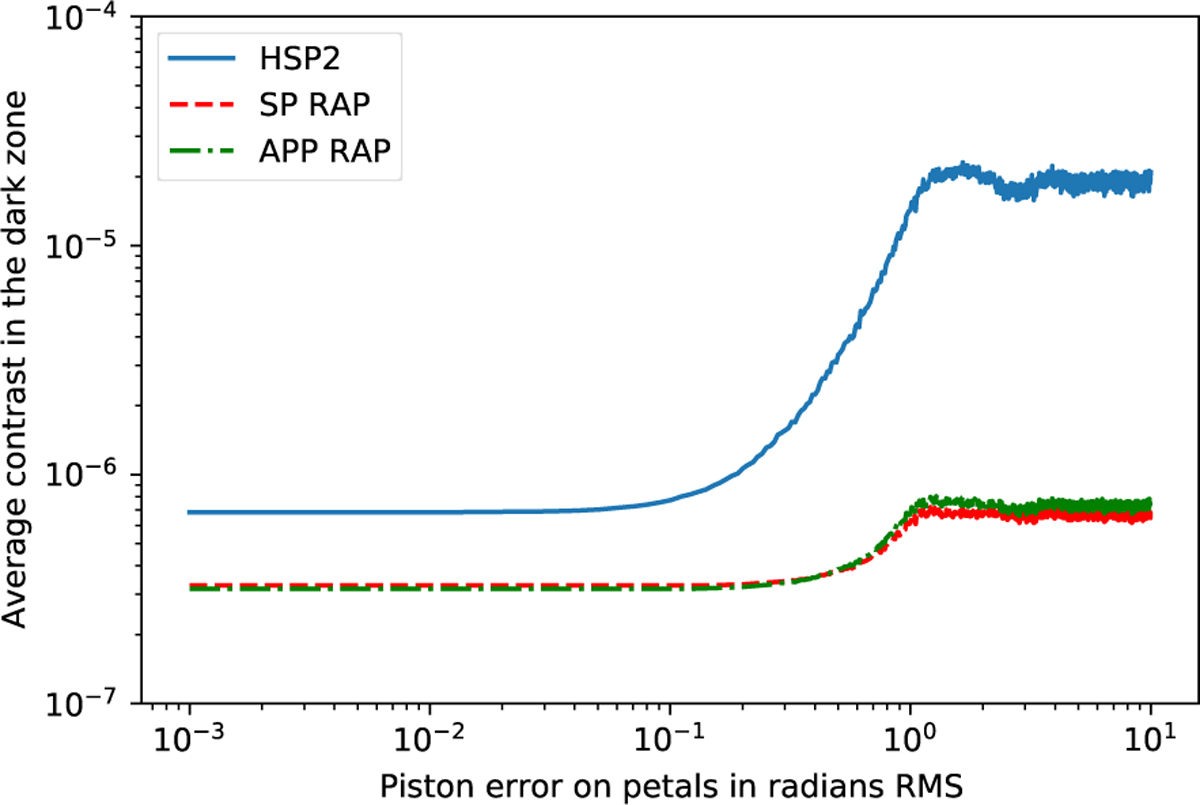
Fig. 7
Download original image
Evolution of the contrast with the piston-like low-wind effect errors between petals with the HSP2 design (blue), the amplitude RAP design (red), and the phase RAP design (green). For each amplitude error considered here, 100 random phase maps are simulated and propagated through the coronagraph, and the average of the 100 contrasts is plotted here.
Current usage metrics show cumulative count of Article Views (full-text article views including HTML views, PDF and ePub downloads, according to the available data) and Abstracts Views on Vision4Press platform.
Data correspond to usage on the plateform after 2015. The current usage metrics is available 48-96 hours after online publication and is updated daily on week days.
Initial download of the metrics may take a while.