Fig. 5
Download original image
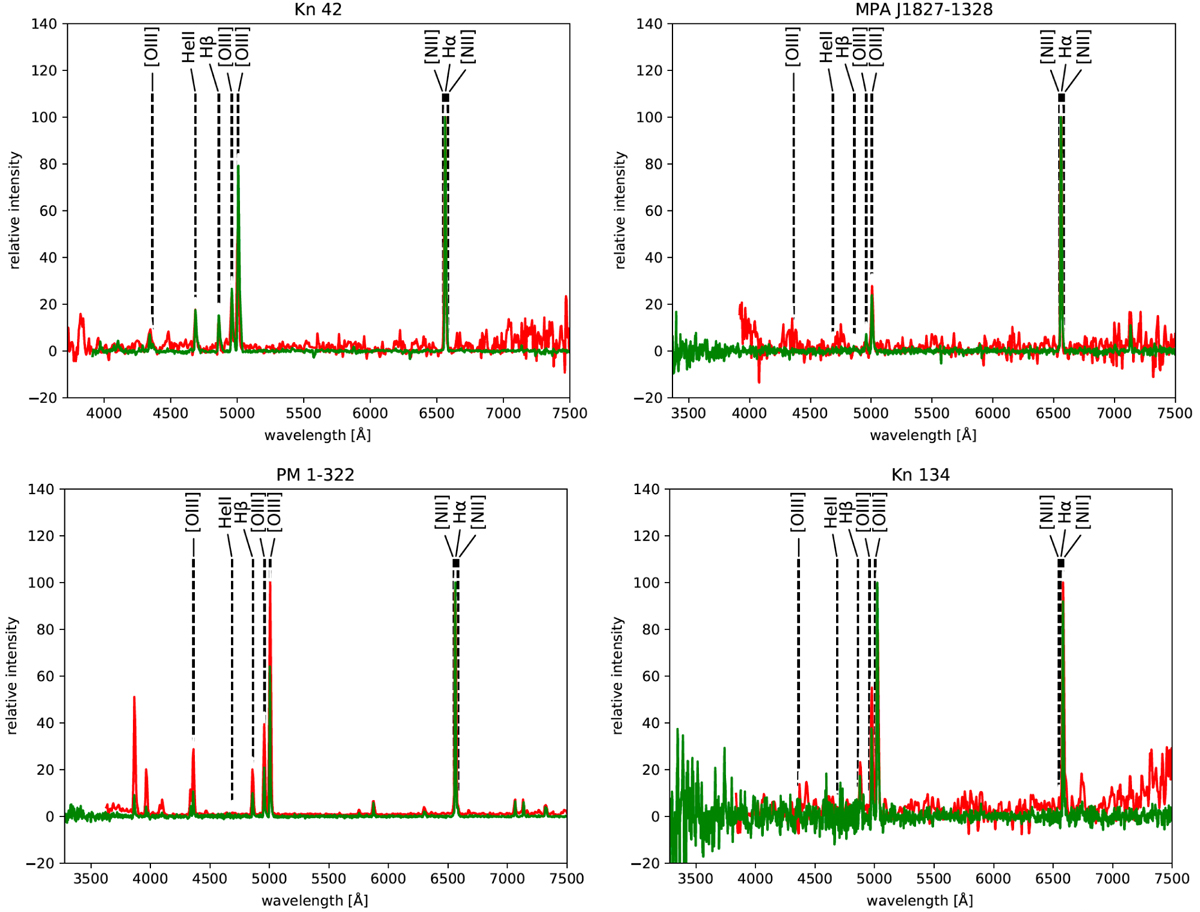
Sample of spectra taken directly from the HASH database for comparison and to show what the HASH interactive spectral plotting utility looks like. Individual emission lines can be identified and labelled. Various spectra can be overplotted and the cursor used to zoom in on interesting regions. In this example the green spectra are from the SAAO 1.9 m professional telescope and the red spectra are from our amateur 0.2 m telescope. Top left: Kn 42 True PN; top right: MPA J1827-1328 True PN; bottom left: PM 1-322, possible symbiotic system; bottom right: Kn 134, emission-line galaxy.
Current usage metrics show cumulative count of Article Views (full-text article views including HTML views, PDF and ePub downloads, according to the available data) and Abstracts Views on Vision4Press platform.
Data correspond to usage on the plateform after 2015. The current usage metrics is available 48-96 hours after online publication and is updated daily on week days.
Initial download of the metrics may take a while.