Fig. 8
Download original image
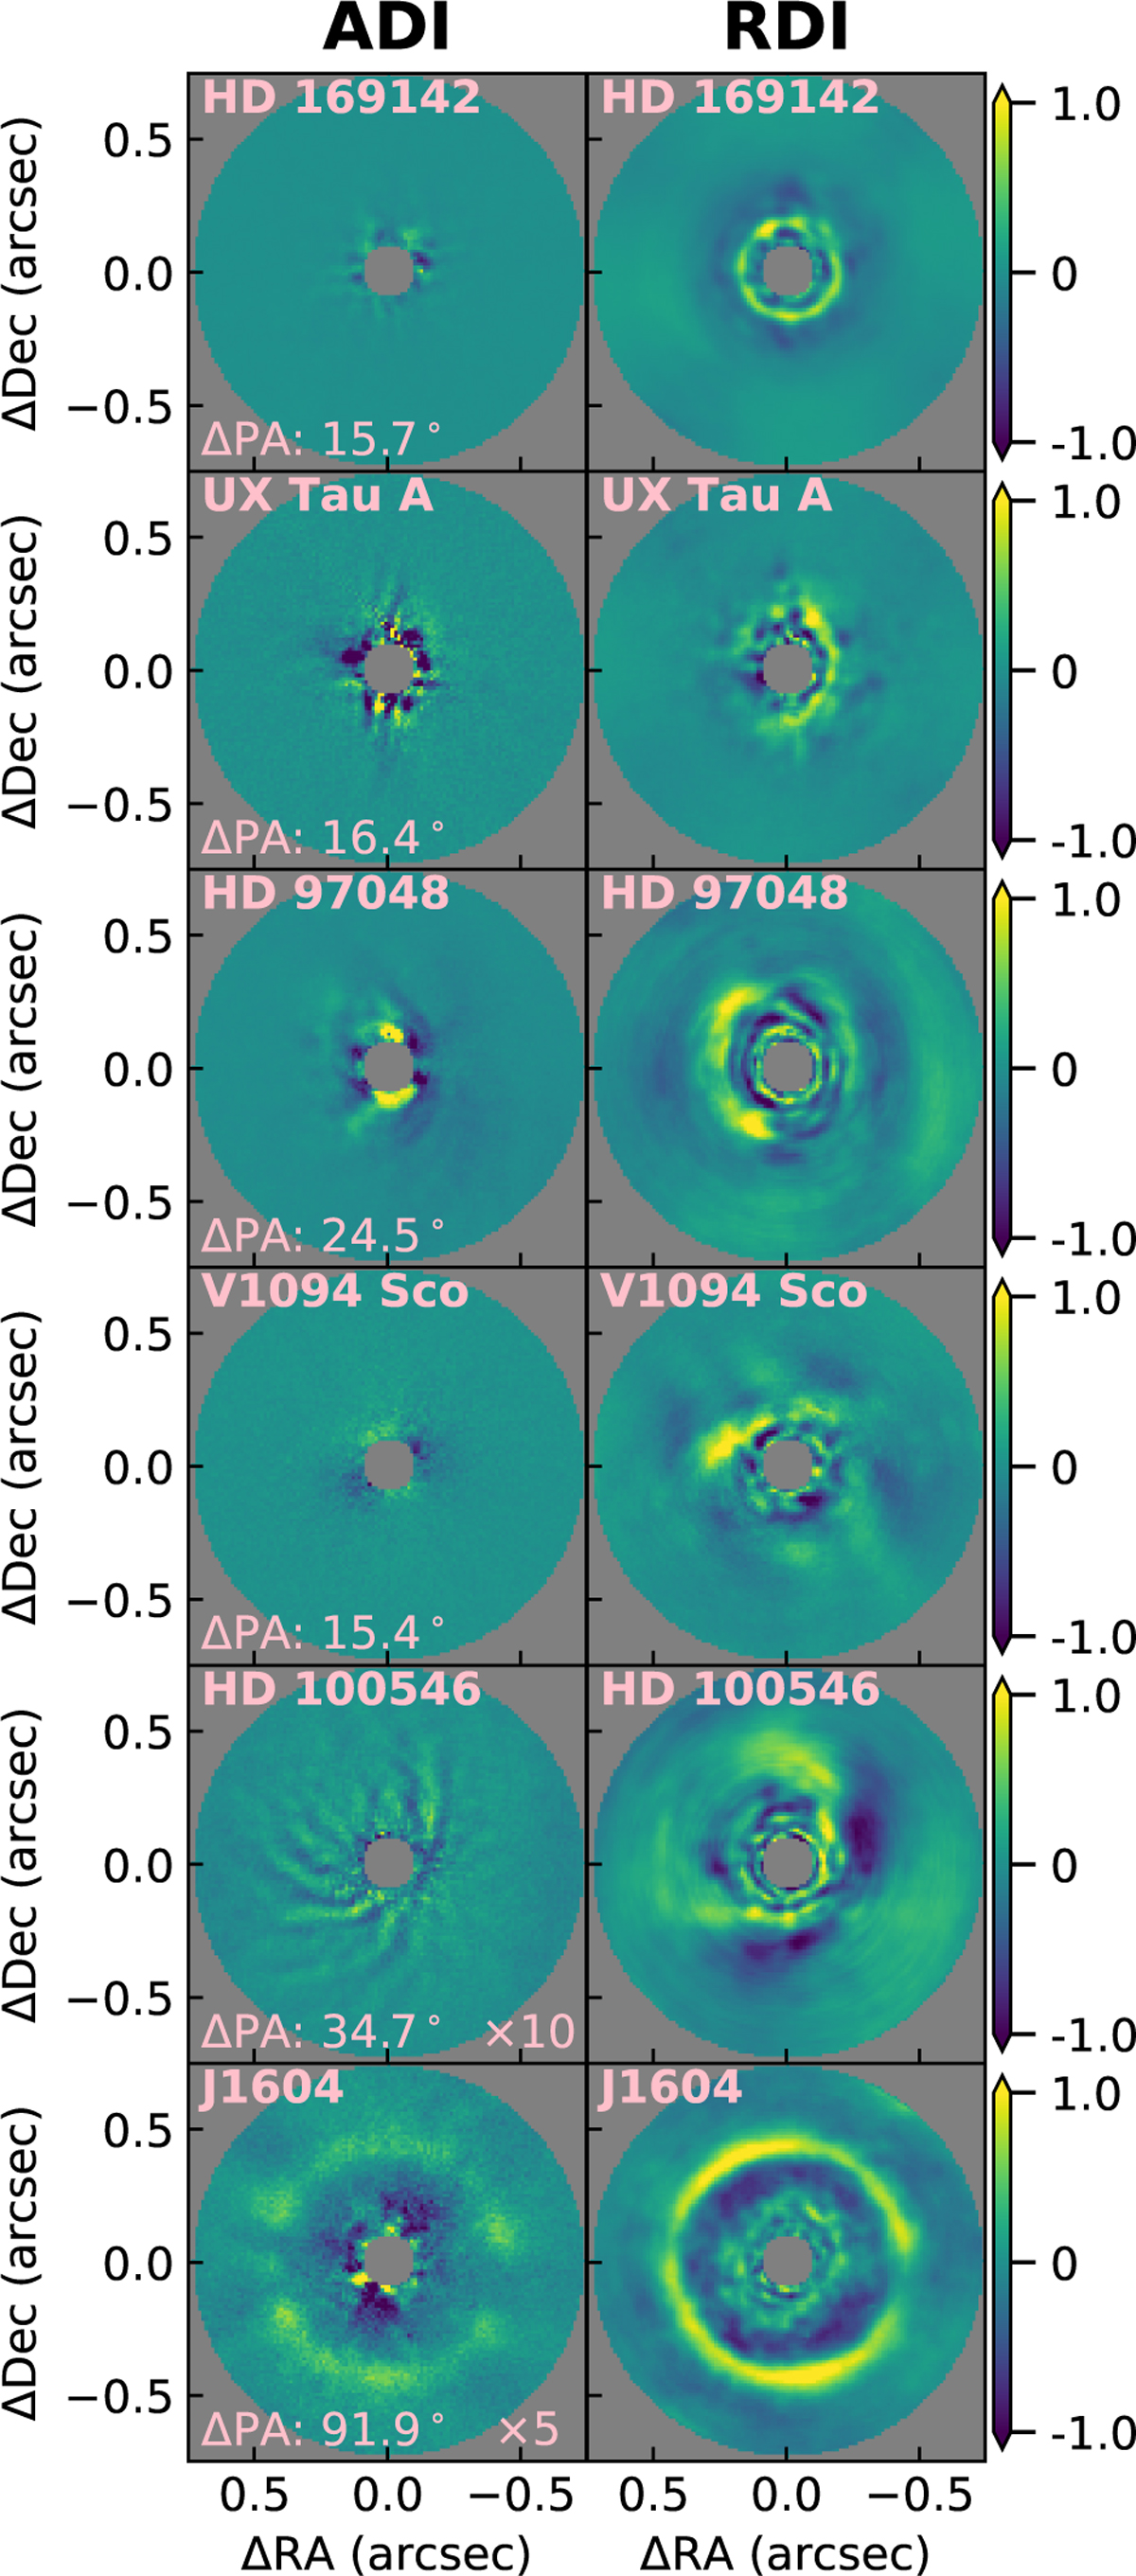
Comparison of SPHERE/IRDIS disk images in H23 reduced with ADI (left) and RDI (right). An arbitrary linear color scale is applied, which is normalized to the maximum flux in the RDI image of each target. Because the ADI images of HD 100546 and J1604 severely suffer from flux loss due to self-subtraction, we linearly scaled these ADI images by factors of 10 and 5, respectively. The star is located in the center of each image. The central gray region shows the position of the coronagraph mask with a diameter of 196 mas (16 pixels). The adopted FoV is 0.735″ in radius.
Current usage metrics show cumulative count of Article Views (full-text article views including HTML views, PDF and ePub downloads, according to the available data) and Abstracts Views on Vision4Press platform.
Data correspond to usage on the plateform after 2015. The current usage metrics is available 48-96 hours after online publication and is updated daily on week days.
Initial download of the metrics may take a while.