Fig. 2.
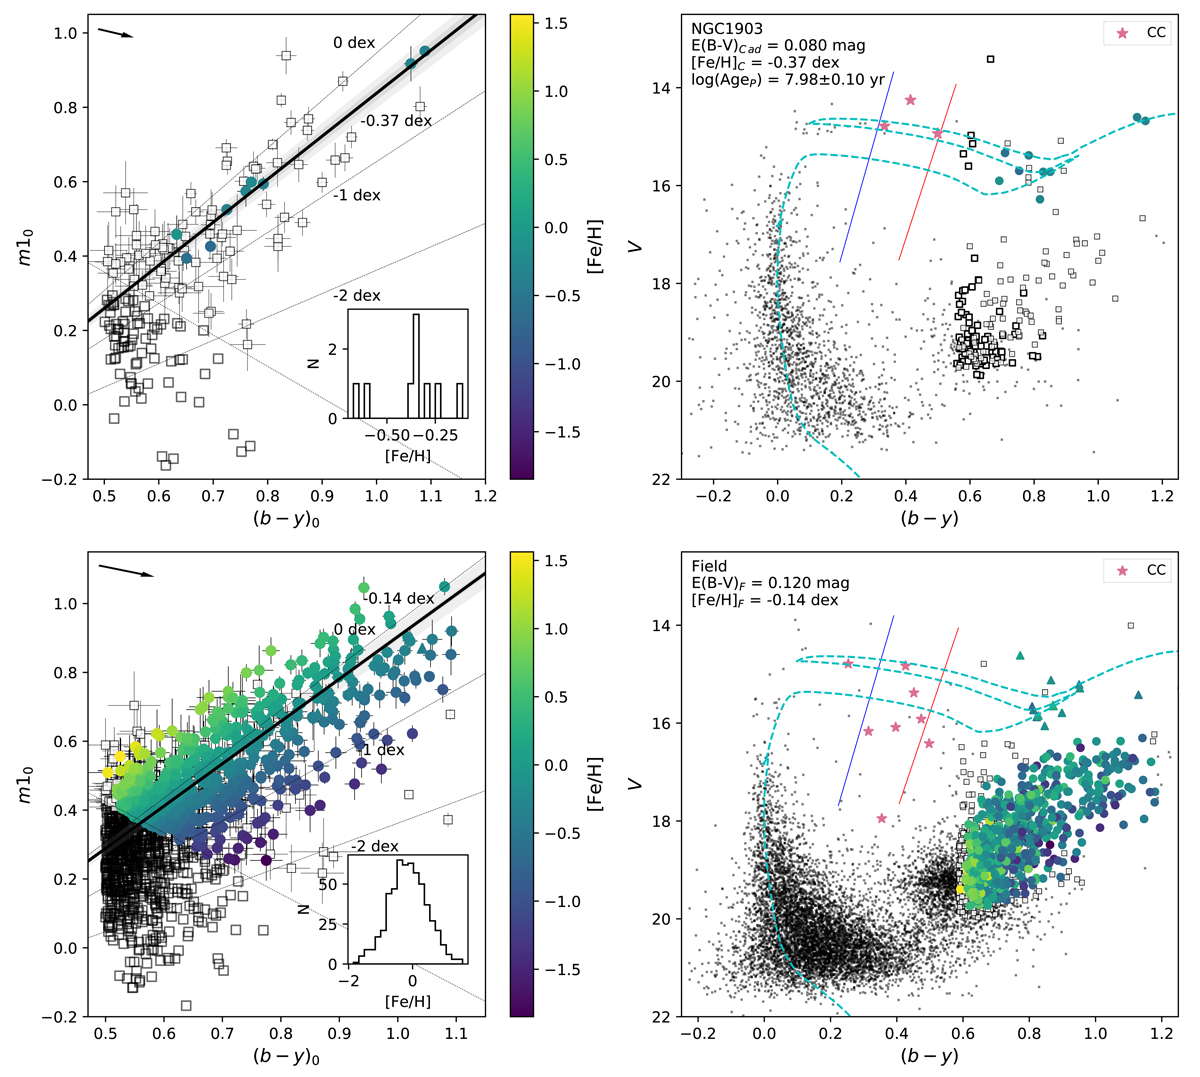
Download original image
Reddening-corrected two-color diagrams (left panels) and reddened CMDs (right panels) for NGC 1903 (upper panels) and the surrounding field stars (lower panels). Right panels: Cepheid variables (pink stars) cross-matched with OGLE catalogs; the young field giants (triangles). The blue and red lines on the CMDs mark edges of the empirical instabillity strip of Cepheids derived by Narloch et al. (2019). The rest of the symbols are the same as in Fig. 1.
Current usage metrics show cumulative count of Article Views (full-text article views including HTML views, PDF and ePub downloads, according to the available data) and Abstracts Views on Vision4Press platform.
Data correspond to usage on the plateform after 2015. The current usage metrics is available 48-96 hours after online publication and is updated daily on week days.
Initial download of the metrics may take a while.