Open Access
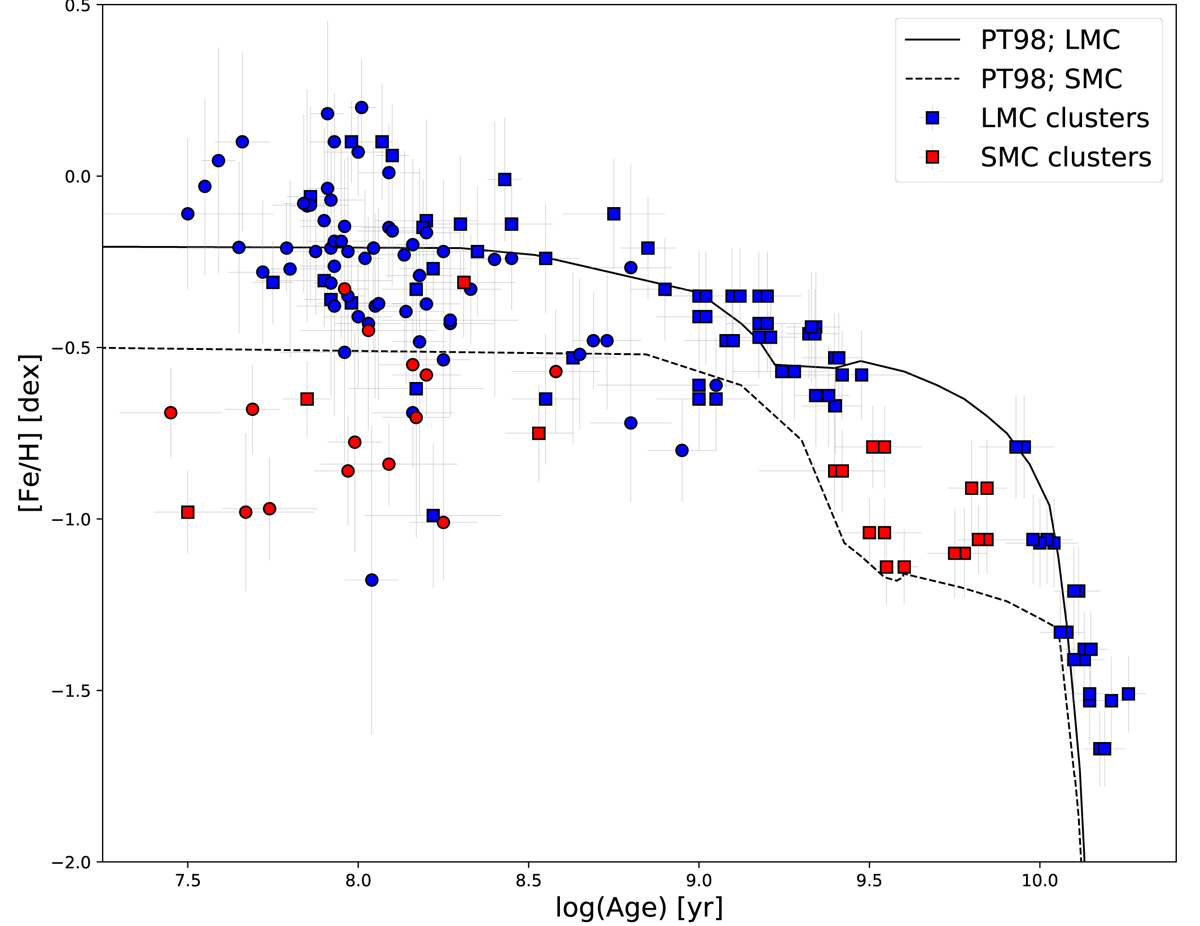
Fig. 13.
Download original image
Comparison of the AMR of the LMC (blue) and the SMC (red). Overplotted are the PT98 bursting models (solid and dashed lines for the LMC and the SMC, respectively). The meaning of squares and circles as in Fig. 6.
Current usage metrics show cumulative count of Article Views (full-text article views including HTML views, PDF and ePub downloads, according to the available data) and Abstracts Views on Vision4Press platform.
Data correspond to usage on the plateform after 2015. The current usage metrics is available 48-96 hours after online publication and is updated daily on week days.
Initial download of the metrics may take a while.