Fig. 9
Download original image
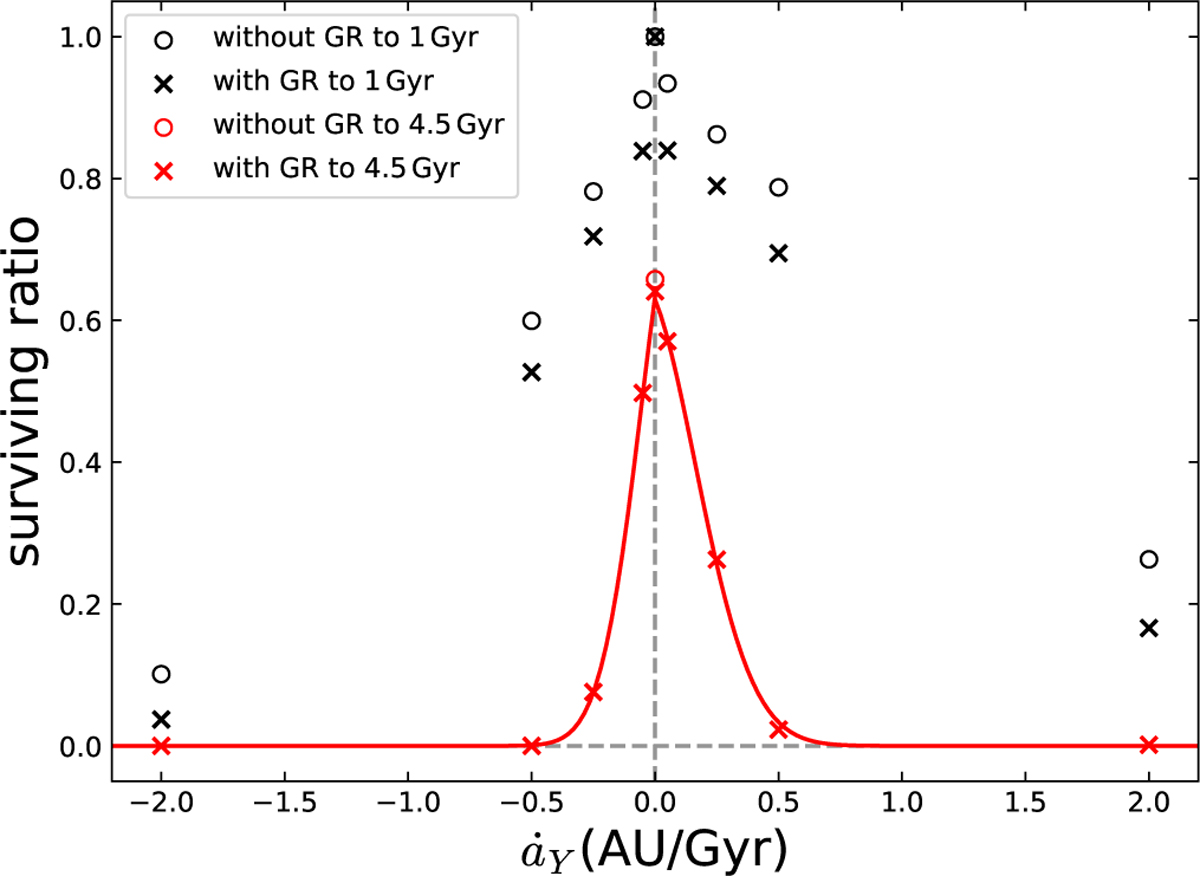
Survivor ratio of VTs under the Yarkovsky effect. Black refers to the results of an integration to 1 Gyr, and red shows this for 4.5 Gyr. The crosses and open circles refer to the results with and without GR, respectively. The survivor ratio of 1.0 right at the centre shows the case ȧY = 0 (without the Yarkovsky effect). Solid lines are the fitting curves of the data for 4.5 Gyr with GR (red crosses, see text).
Current usage metrics show cumulative count of Article Views (full-text article views including HTML views, PDF and ePub downloads, according to the available data) and Abstracts Views on Vision4Press platform.
Data correspond to usage on the plateform after 2015. The current usage metrics is available 48-96 hours after online publication and is updated daily on week days.
Initial download of the metrics may take a while.